
Figures & data
Figure 1. Elimination of neutrophils causes severe colitis and expansion of proinflammatory TCRγδ+CD8αα+ IELs in mice. Acute colitis was induced in WT mice (n = 6 per group) by 2% DSS in drinking water and treated intraperitoneally with anti-mouse Ly6G antibody (αLy6G) and rat IgG2a (100 μg/mouse), respectively, every three days. (a, b) Flow cytometric analysis of TCRγδ+CD8αα+ IELs (a) and TCRαβ+CD4+ IELs (b, gated TCRαβ+ IELs. The proportion of TCRαβ+CD4+ IELs is obtained by calculating the proportion of TCRαβ-CD4 double positive IELs) in the colon of the indicated groups on day 10. Bar charts showed the proportion and the absolute number of indicated IELs. (c) The frequencies of IFN-γ-, IL-17A-, TNF-α-, and IL-10-expressing TCRγδ+CD8αα+ IELs and TCRαβ+CD4+ IELs isolated from the colon of the indicated WT mice (n = 6 per group) were detected by flow cytometry and counted into the statistical chart. (d-h) Acute colitis was induced in WT and Cd177−/− mice (n = 6 per group) by 2% DSS in drinking water and treated intraperitoneally with αLy6G antibody and rat IgG2a (100 μg/mouse), respectively, every three days. (d) Representative H&E staining of the colon tissues from WT and Cd177−/− mice treated with rat IgG2a or αLy6G antibody throughout the 10-day observation after DSS insults. Scale bar, 100 µm. Histological scores were shown as indicated (n = 6 per group). (e) Serum levels of FITC-dextran (4 kD, 600 mg/kg) in each group. (f, g) Flow cytometric analysis of TCRγδ+CD8αα+ IELs (f) and TCRαβ+CD4+ IELs (g, gated TCRαβ+IELs) in the colon of each group. Bar charts showed the proportion and the absolute number of indicated IELs. (h) The frequencies of IFN-γ-, IL-17A-, TNF-α-, and IL-10-expressing TCRγδ+CD8αα+ IELs isolated from the colon of colitic WT and Cd177−/− mice treated with rat IgG2a or αLy6G antibody (n = 6 per group), assessed by flow cytometry and counted into the statistical chart. Data were representative of three independent experiments. *p < .05; **p < .01; ***p < .001; and ****p < .0001 and ns, no significant difference.
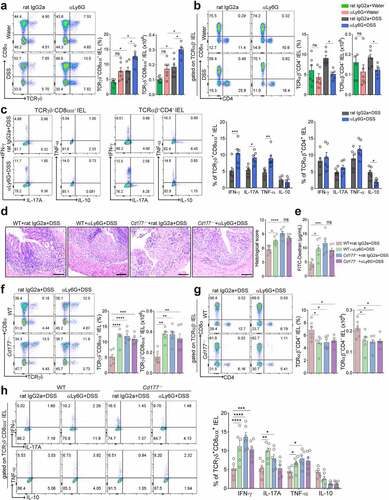
Figure 2. Gene expression signatures in TCRγδ+CD8αα+ IELs identify proinflammatory patterns and hyper-responsiveness to microbiota. A total of 14,301 single cells were isolated from mucosal epithelia of the colon of DSS-treated Cd177−/− mice and WT littermates through CD45+ immuno-magnetic bead sorting (n = 3 per group). (a) Unsupervised t-SNE analysis of IEL subclusters. (b) Unsupervised t-SNE analysis of IEL subclusters from DSS-treated Cd177−/− mice and WT littermates. (c) Identification of TCRγδ+CD8αα+·IELs (C2). (d) Gene Ontology (GO) analysis of upregulated and downregulated differentially expressed genes from TCRγδ+CD8αα+·IELs. (e) Dot plots of the selected gene expression in each cluster, colored by the average expression of each gene in each cluster, scaled across all clusters. The red and blue circles represent Cd177−/− and WT mice, respectively. The depth of the color indicates the level of gene expression. Dot size represents the percentage of cells expressing the respective gene in each cluster.
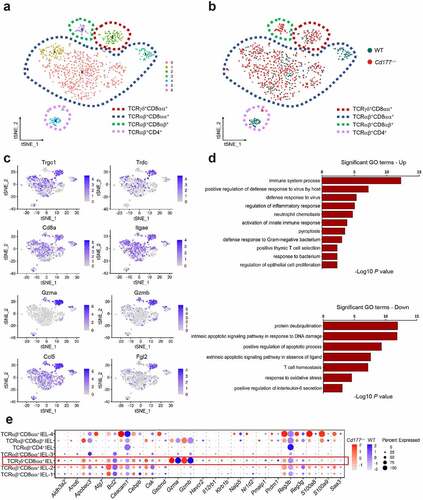
Figure 3. Microbial dysbiosis in DSS-induced colitic Cd177−/− mice. (a) Differential OTUs of microbiotas in pre-DSS- and post-DSS-treated Cd177−/− and WT mice. (b) PCoA plots of the bacterial communities (16S rRNA gene amplicons) in Cd177−/− and WT mice feces pre- and post-DSS exposure (n = 3 per group). (c, d) Relative abundance of bacterial diversity of indicated groups at the phylum level (c) and the genus level (d). (e) Upregulated bacteria in the feces of Cd177−/− mice after DSS exposure. (f) Downregulated bacteria in the feces of Cd177−/− mice after DSS exposure. *p < .05; **p < .01; ***p < .001; and ****p < .0001.
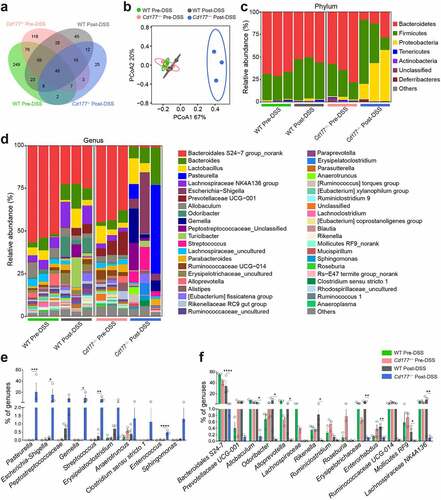
Figure 4. Alterations of the fecal metabolome in Cd177−/− mice. Fecal samples from DSS-treated Cd177−/− mice and WT littermates were collected on days 0 and 10 for unbiased metabolomics analysis (n = 4 per group). (a) Venn diagrams show the number of differently expressed metabolites detected in each group. (b) Partial Least Squares Discrimination Analysis (PLS-DA) of DSS-treated Cd177−/− mice and WT littermates. (c) The volcano diagram represents all differentially expressed metabolites between DSS-treated Cd177−/− mice and WT littermates. (d) Heatmap of differently expressed immunomodulatory metabolites between DSS-treated Cd177−/− mice (KO) and WT littermates. (e) The levels of DMF in the fecal samples of the indicated groups. (f) Fold changes in fumarate-producing microbiota (blue) and fumarate-consuming microbiota (red) in the feces of colitic Cd177−/− mice compared with colitic WT mice. *p < .05.
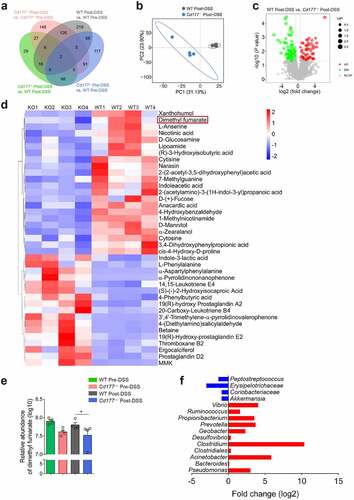
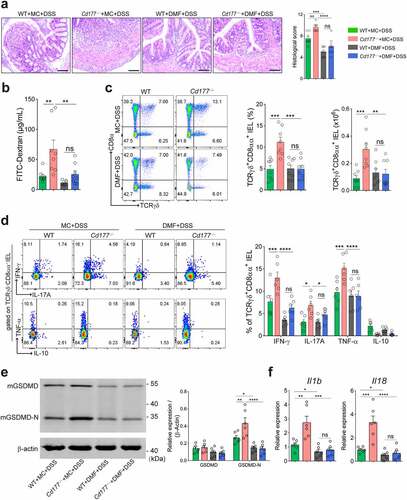
Figure 5. Administration of DMF ameliorates DSS-induced colitis in Cd177−/− mice. Acute colitis was induced in WT (n = 8) and Cd177−/− (n = 8) mice by 2% DSS in drinking water and treated orally with methocel (MC) or DMF (100 mg/kg) daily throughout the 10-day observation. (a) Representative H&E staining of the colon tissues was obtained from these mice on day 10. Scale bar, 100 µm. Histological scores were shown as indicated. (b) Serum levels of FITC-dextran in each group. (c) Flow cytometric analysis of TCRγδ+CD8αα+ IELs in the colon of each group on day 10. Bar charts showed the proportion and the absolute number of the indicated IELs. (d) The frequencies of IFN-γ-, IL-17A-, TNF-α-, and IL-10-expressing TCRγδ+CD8αα+ IELs isolated from the colon of colitic WT and Cd177−/− mice treated with MC or DMF (n = 6 per group), assessed by flow cytometry and counted into the statistical chart. (e) The full-length GSDMD and GSDMD-N in flow-sorted TCRγδ+CD8αα+ IELs of indicated groups were determined by Western blot. Bar charts showed the relative expression of GSDMD and GSDMD-N. (f) The mRNA levels of pyroptosis-associated cytokines in flow-sorted TCRγδ+CD8αα+ IELs (n = 6 per group). Data were representative of three independent experiments. *p < .05; **p < .01; ***p < .001; and ****p < .0001 and ns, no significant difference.
Supplemental Material
Download Zip (13.7 MB)Data availability statement
All data supporting the findings of this study are included in the article and/or the supplementary materials. The original data sets are also available from the corresponding author upon request.