
Figures & data
Figure 1. Longitudinal changes of gut microbiota components in Alzheimer’s disease and wild-type mice during development. (a). Impacts of environmental factors on gut microbiota (GM) differences observed by permutational multivariate analysis of variance (PERMANOVA) analysis. The contributions of environmental factors to GM variance were quantified with R2, and age significantly influenced GM differences. (b). Results of Bray–Curtis distance-based principal coordinates analysis (PCoA) with all samples; dots and triangles indicate samples from the Alzheimer’s disease (AD) and wild-type (WT) mice, respectively. Colors indicate mouse age: red, one month; blue, two months; Orange, three months; green, six months; yellow, nine months. Circles contain samples with 95% confidence intervals for the groups stratified by age. (c, d) PCoA results of the WT (c) and AD (d) samples. Colors indicate mouse age: pink, one month; grass green, two months; green, three months; blue, six months; purple, nine months. (e, f) Inter-group GM differences of the WT (e) and AD (f) mice. Horizontal and vertical axes indicate mouse age and the Bray–Curtis distance, respectively. (g) Fluctuation patterns of bacterial genera in the AD and WT mice. The min–max-normalized genera abundances in the AD and WT mice are indicated by red and blue, respectively.
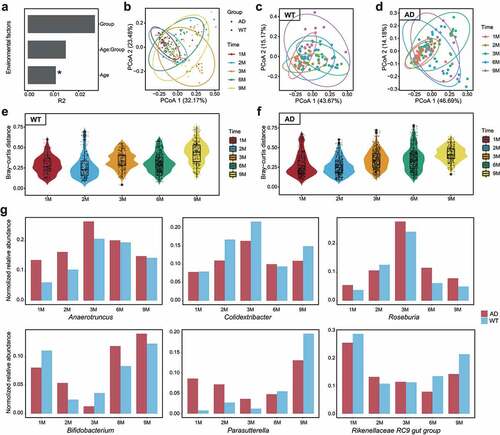
Figure 2. Dynamic changes of the gut microbiota co-occurrence networks in Alzheimer’s disease and wild-type mice. (a) Gut microbiota (GM) co-occurrence networks with respect to mouse age in the Alzheimer’s disease (AD) and wild-type (WT) mice. In the networks, each node indicates a genus, and its size indicates relative abundance. Pink and green edges indicate positive and negative correlations, respectively. Histograms show the degree distributions of nodes of the networks. (b–g) Topological features of GM co-occurrence networks in the mice, including the dynamic changes of nodes (b), edges (c), average degree (d), clustering coefficient (e), connectance (f), and hub nodes (g). The WT and AD groups are indicated by blue and red, respectively.
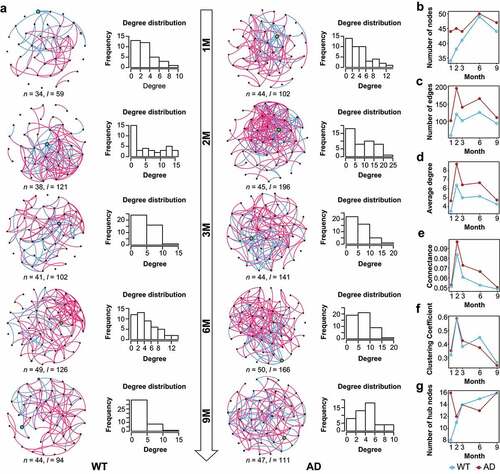
Figure 3. Vulnerability, stability, and robustness assessment of the gut microbiota co-occurrence networks. (a, b) Dynamic changes of the vulnerability (a) and stability (b) of the gut microbiota (GM) co-occurrence networks with respect to mouse age. Red and blue indicate the Alzheimer’s disease (AD) and wild-type (WT) mice, respectively. (c, d) Computational simulation-based robustness assessment results of the GM co-occurrence networks in the WT (c) and AD (d) mice. Different strategies are indicated by different colors. TR: hub bacteria-based target removal; RA: non-hub bacteria-based random attack. ** P < .01, *** P < .001.
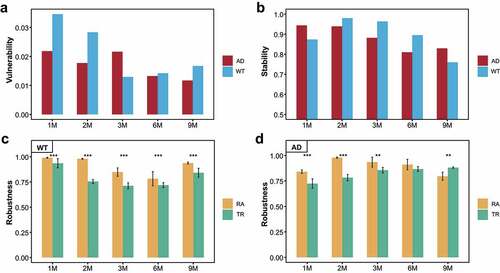
Figure 4. Random-forest models to distinguish the gut microbiota between Alzheimer’s disease and wild-type mice during development. (a–e) Receiver operating characteristic (ROC) curves and areas under curve (AUCs) for the random-forest models with three-fold cross-validation at the one, two, three, six, and nine months of age. (f) Heatmap of the scaled Gini values in different random-forest models with respect to mouse age. Yellow and blue panels indicate bacteria with high and low Gini values, respectively.
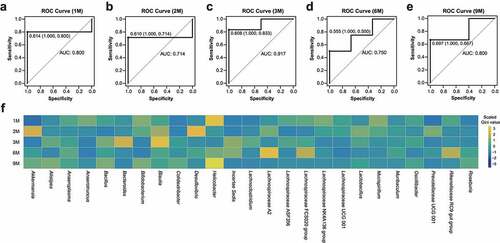
Figure 5. Distribution of gut–brain modules in Alzheimer’s disease and wild-type mice. (a) Presence of gut–brain modules (GBMs) among the hub bacteria of the Alzheimer’s disease (AD) and wild-type (WT) mice. Horizontal and vertical axes show the GBMs and genera, respectively. Yellow circles indicate the presence of GBMs in the genus. Genera marked in red, blue, and gray are the hub bacteria present in the AD mice, WT mice, and both, respectively. (b) Fluctuations of GBMs with respect to age in the AD and WT mice. The GBMs were sorted according to their peak abundances at different ages in the AD and WT mice. Orange and blue indicate high and low abundance, respectively.
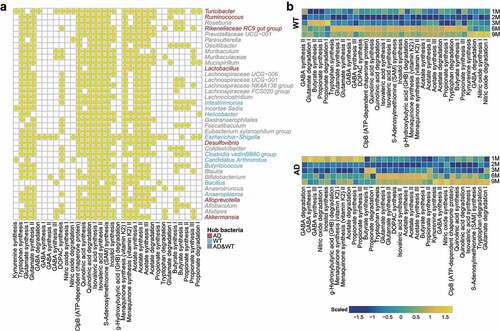
Figure 6. Differentially enriched neuroactive functions and corresponding hub bacteria in three-month-old Alzheimer’s disease mice. (a) Differentially enriched gut–brain modules (GBMs) in the Alzheimer’s disease (AD) mice at three months of age. The mean proportion of the GBM (left) and 95% confidence intervals in the enriched group (right) are shown. The AD and wild-type (WT) groups are indicated by red and blue, respectively. (b) Comparison of the hub bacteria responsible for the differentially enriched GBMs between the AD and WT mice. The AD and WT mice are indicated by red and blue, respectively. * P < .05.
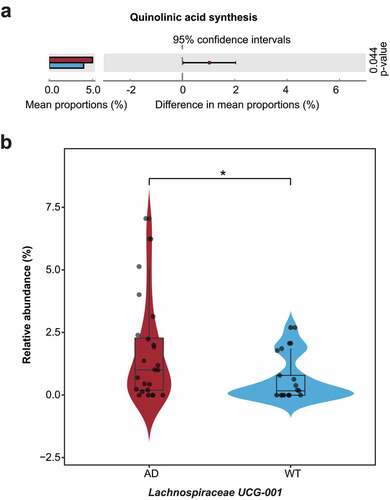
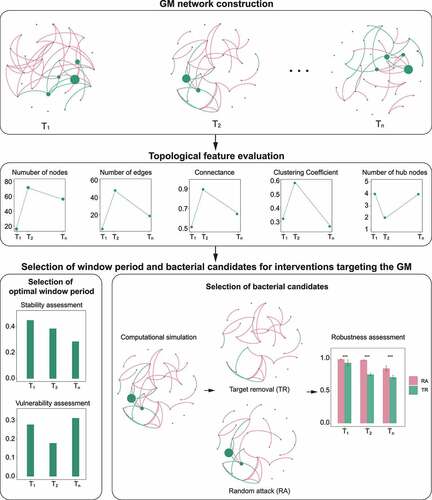
Figure 7. Framework for gut microbiota network modeling. The framework primarily comprises four components: GM network construction, topological feature evaluation, and the selection of window period and bacterial candidates for interventions targeting the GM.
Supplemental Material
Download Zip (10.6 MB)Data availability statement
The complex network-based GM modeling algorithm codes and computational simulation process are publicly available in the GitHub repository (https://github.com/liyinhu/GM_network_modeling). The 16S rRNA sequencing data have been deposited in the NCBI Sequence Read Archive (SRA) repository under BioProject accession number PRJNA543965 (https://www.ncbi.nlm.nih.gov/bioproject/543965). All other data are available from the authors upon reasonable request.