Figures & data
Figure 1. A minimal intestinal microbiome of nine strains performs complete carbohydrate fermentation. a. The trophic cascade of essential metabolic reactions ferments carbohydrates into the end metabolites acetate, propionate, and butyrate. ‘A reactions’ convert primary substrates to intermediate or end metabolites, and ‘B reactions’ convert intermediate metabolites. ‘C-reactions’ consume oxygen and hydrogen that can inhibit fermentative activity. b. The combined metabolic activity of nine selected species covers all essential reactions of the trophic cascade. Five primary degraders produce intermediate metabolites and acetate from primary substrates. Four secondary degraders consume intermediates and produce end metabolites. Hydrogen and oxygen metabolism were attributed to strains using published data. Y: YCFA, M: M2GSC, FO: formate, LT: lactate, SU: succinate, AC: acetate, BU: butyrate, PR: propionate. c. Log fold change of single strains (in gray) and co-cultured strains (PB002; in black) as determined by qPCR for three replicate experiments with three technical replicates from time point 0 h and 48 h with SD. The data are normalized by the 16S rRNA gene copy number of each strain. (†) The starting cell concentration of A. lactatifermentans could not be quantified in the mixed culture, thus the starting concentration of the single cultures was used as a proxy. Culturing was performed in Hungate tubes for single strains and PB002. d. Metabolites produced by either single cultures or the PB002 consortium. Intestine image adapted from Staff, Blausen.com. 2014. WikiJournal of Medicine 1(2).Citation37
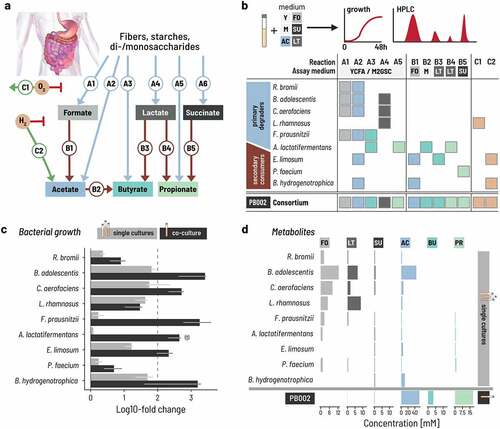
Figure 2. Fed-batch and controlled inoculation ratios of strains promote the successional colonization of bioreactors. a. Two adjustments to the fermentation strategy were compared: using either a batch or a fed-batch setup over 48 h with two different inoculation ratios, ‘equal volumes’ (EV; black lines) or ‘controlled ratio’ (CR+batch, green lines; CR+fed-batch, Orange lines). Batch fermentation was inoculated at 0.33% v/v and fed-batch bioreactors at 0.66% v/v to balance the doubling of medium during fed-batch fermentation. The volume was doubled by adding fresh medium after 24 h in fed-batch mode. b. The total concentration of metabolites produced, expressed in carbon mol concentration, increases steadily in batch mode with either inoculation ratios (EV: black, CR: green). The vertical dashed line indicates the time of medium refill for the fed-batch setup. Each of the three conditions were run in duplicate. Lines and vertical bars show the mean and spread, respectively. Metabolites were quantified by HPLC-RI analysis. Total carbon production was calculated by summing the C-mol of all measured metabolites. c. We computed the rate of carbon extraction as the empirical difference of the C-mol concentration during the last measurement period and expressed per unit time (hour, h). The lines show the mean of, and the vertical segments show the spread between the duplicates. d. Intermediate (formate, lactate) and end (acetate, butyrate, propionate) metabolites are dynamic during the 48 h fermentation. Each line shows the mean of, and the vertical segments the spread between the duplicates. e. The growth of the nine strains differed between the strategies. Cell counts were determined by qPCR, whereby each time point was measured in triplicate. The lines show the median and the vertical segments show the min and max of the triplicate. The measured gene counts are normalized by the 16S rRNA gene copy number of each strain. Rb: R. bromii; Ba: B. adolescentis; Ca: C. aerofaciens; Lr: L. rhamnosus; Fp: F. prausnitzii; Al: A. lactatifermentans; El: E. limosum; Pf: P. faecium; Bh: B. hydrogenotrophica.
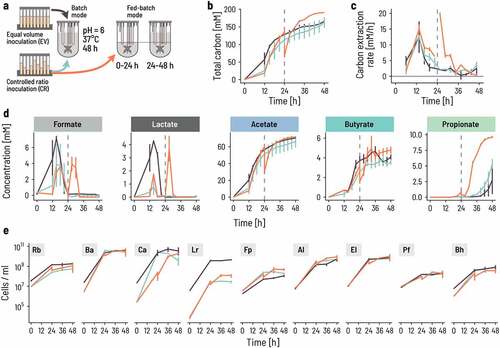
Figure 3. Continuous co-cultivation directs the consortium into a characteristic metabolic and compositional equilibrium. a. Four bioreactors were inoculated at 0.66% v/v at either equal volumes (blue lines) or controlled ratios (Orange lines). Fed-batch fermentation was carried out for the first 48 h, whereby the fermentation volume was doubled after 24 h of fermentation by adding fresh PBMF009 medium. After 48 h, the system was set to continuous mode. Fermentation conditions were chosen to reflect conditions of the human colon, at 37°C, pH 6.0 and a mean retention time of 50 h, or D = 0.02/h (see Methods for details). b,c. The concentration of metabolites changes over the course of the experiment. The lines show the mean and the error bars the range between the duplicates. d. The strain composition at sampling points throughout the experiment evolves from the inoculum composition to a common equilibrium composition (dashed circle). Principal components (PC) are computed from the center log-ratio transformed relative cell concentrations. The circles show the endpoint of the fermentation, and the black and yellow background corresponds to the fed-batch and continuous phase, respectively. e. Cell concentrations for each of the nine strains are dynamic through time. Each sampling point is the median of three technical qPCR replicates and the error bars show the minimum and maximum measurements.
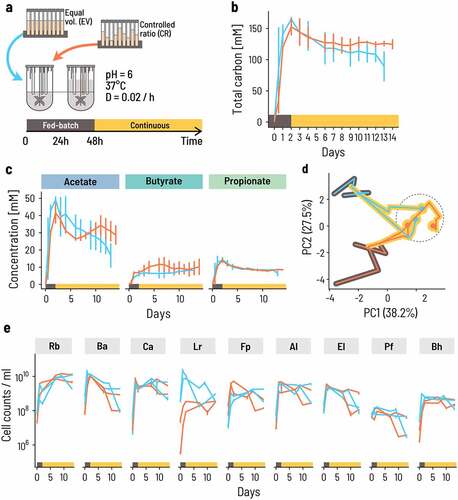
Figure 4. The onset of growth and activity occurs sooner for the consortium than a mix of strains. a. We compared the growth and metabolic activity of the co-cultured consortium to that of a mix of the same nine strains pooled together to imitate the cell counts of the individual strains at equilibrium. Strict anaerobic serum flasks containing PBMF010 medium were inoculated with either a consortium sample from the continuous fermentation, or an ‘Artificial Mix (AM)’ of single strains at the same ratios as in the continuous fermentation. b-d. Metabolite concentrations in terms of mol of carbon were measured during 48 h. e. Cell counts of each of the nine strains were measured using qPCR.
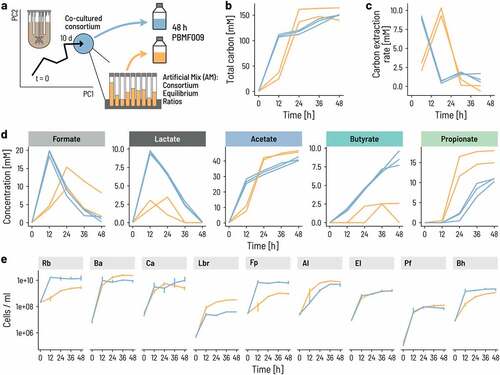
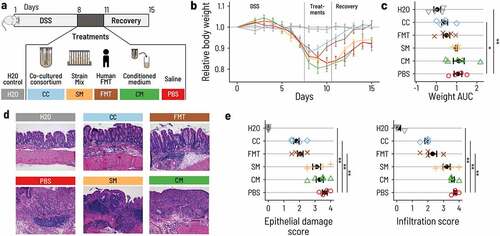
Figure 5. PB002 accelerates recovery after DSS-induced colitis in mice. a. Acute colitis was induced in female C57BL/6 mice by supplementing the drinking water with DSS for 7 d (from day 1 to day 8). At day 8, mice were switched back to normal drinking water. Mice were treated once a day by 200 μL oral gavage on days 8, 9, and 10 with the co-cultured consortium (CC, blue), the non-co-cultivated strain mix (SM, Orange), the conditioned medium from the continuous fermentation (CM, green), or with FMT from a healthy human donor (FMT, brown). The control group was given normal water throughout the whole experiment (H2O, gray), and the DSS control group was gavaged with phosphate-buffered saline (DSS, red). Mice were euthanized at day 16. N = 4 to 5 per group. b. Mice treated with CC or FMT regained body weight more rapidly than mice that received the other treatments. Error bars are the standard errors. c. Area under the curve (AUC) of the daily relative body weight for each mouse. Only CC-treated mice had an AUC that was significantly lower than the DSS control mice (linear model, beta = – 0.65, p = .030). The error bars show the confidence interval for the mean. d. Representative light micrographs of large intestine sections at the time of euthanasia (H&E staining, 10 X magnification). CC and FMT showed structural recovery of the epithelium comparable to the control group. Mice that received CM, SM, or PBS showed a substantial degradation and inflammation of the cecal epithelium. e. Histological assessment of the epithelial damage and infiltration in the distal colon. Treatment with CC and FMT showed reduced epithelial damage and infiltration compared to PBS (linear model, p < 10−Citation4 for all marked comparisons).