
Figures & data
Figure 1. Gut microbiome of the infants from rural Kenya included in the study cohort. A. Abundance of bacterial species in the study cohort. B. Network based on the 20 most abundant species. Blue edges correspond to positive estimated associations; Red edges correspond to negative estimated associations and the thickness of the lines indicates the strength of the correlation between taxa.
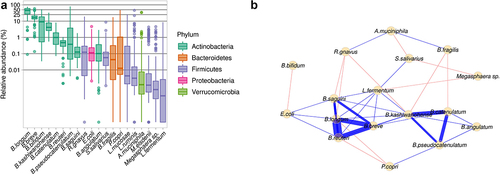
Figure 2. Identification of B. longum subsp. longum and B. longum subsp. infantis in metagenomes. Detection of genes related to B. longum subsp infantis (HMO clusters) and B. longum subsp. longum (araD and araA) in metagenomes from rural Kenyan and Swedish infants (dark and light green, respectively) and in reference genomes of B. longum subsp. longum and B. infantis. Clusters indicate the resulting stratification of metagenomes with the exclusive detection of B. infantis (yellow and blue) and B. longum subsp. longum (Orange) or the detection of both B. infantis and B. longum subsp. longum (red); clustering was performed by complete linkage analysis (Euclidean distance).
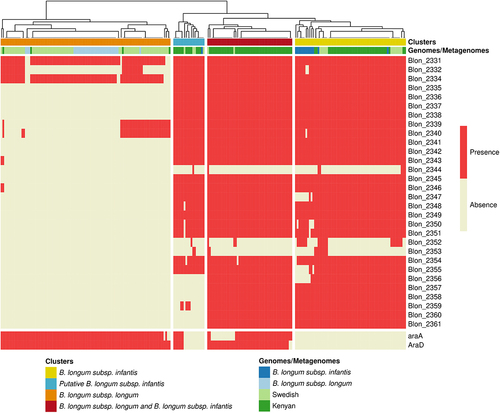
Figure 3. Gut microbiota community types in infants from rural Kenya. A. Abundances of the highest ranked bacterial genera that were statistically significantly different between the three GMC types. B. Abundance of significant Bifidobacterium species (Kruskal-Wallis test, followed by a post-hoc Dunn test; for details see Table S3 for panels A and B). C. Species-based alpha-diversity (species richness and Shannon index). ***p < .001 (Kruskal-Wallis test, followed by a post-hoc Dunn test).
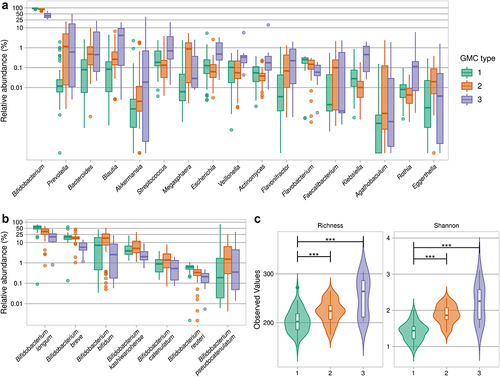
Figure 4. Association between host microbiota markers and the gut microbiota. A. Heatmap of the model coefficient values resulting from the MaAsLin2 analysis of the top 20 species, fecal calprotectin levels and pH. * indicates FDR<0.1 # indicates p< .1. B. Age, pH and calprotectin level distributions between GMC types (Kruskal-Wallis test, followed by a post-hoc Dunn test). “.”p= .05, *** p < .001. C. Exclusive presence of B. infantis or B. longum subsp. longum or the presence of both species in the three GMC types.
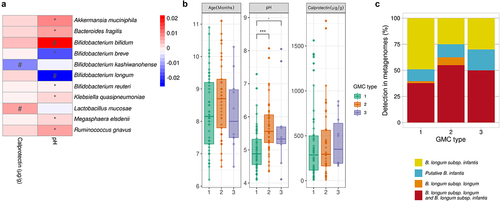
Figure 5. Functional assessment of gut microbiota in the three GMC types. A. Heatmap of the most abundant glycoside hydrolases (GH). Significance (on the left) of differences between GMC types (log2 of mean relative abundance) (Kruskal-Wallis test, followed by a post-hoc Dunn test; FDR<0.05). GHs are ordered in decreasing abundance. The substrates for GHs were taken from Qin et alCitation40 B. Relative abundances of antimicrobial resistance genes (ARG), toxins and virulence factors (VF), as predicted by PathoFact (* p < .05, ** p < .01, and *** p < .001). Kruskal-Wallis test, followed by a post-hoc Dunn test.
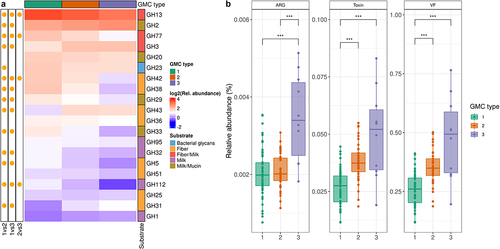
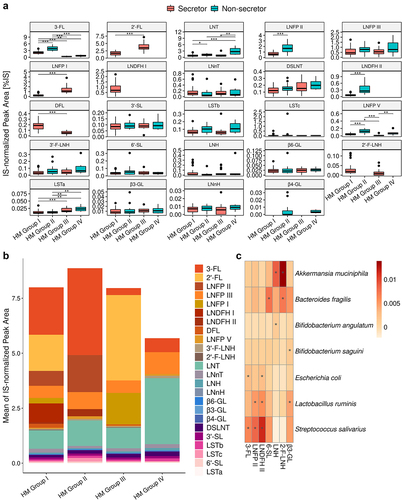
Figure 6. Abundance of the major HMOs stratified by maternal HM group. A. Boxplot of HMOs ranked in descending order of abundance (Mann-Whitney test, * FDR <0.05, ** FDR <0.01, and *** FDR <0.001). B. Mean proportion of HMOs in the different HM groups. Neutral fucosylated HMOs are shown as an orange-red gradient, neutral non-fucosylated HMOs are shown as a blue-green gradient and sialylated acids are shown as a pink-purple gradient C. Heatmap of MaAsLin2 correlation coefficients for the relationship between HMO abundance and bacterial species. HMOs are shown in descending order of abundance.
Supplemental Material
Download Zip (525.4 KB)Data Availability Statement
Metagenomic sequences associated with this project were deposited in EMBL under BioProject accession no. PRJEB52748. The source codes used in this study are available from GitHub (github.com/danone/Kenya.study)