Figures & data
Figure 1. Study overview. (a) CONSORT flow diagram for enrollment, allocation, follow-up, and analysis. (b) Metabolic syndrome guidelines as defined by the International Diabetes Foundation (IDF). (c) Heat map depicting the study inclusion criteria met by participants (rows) along with medication use. Those that only satisfied 2 criteria are indicated by an asterisk. Yellow line separates placebo from probiotic arm. HDL = high density lipoprotein; BP = blood pressure (d) Stool and blood samples along with participant food logs were collected over an 18-week period for microbiome and immune system measurements.
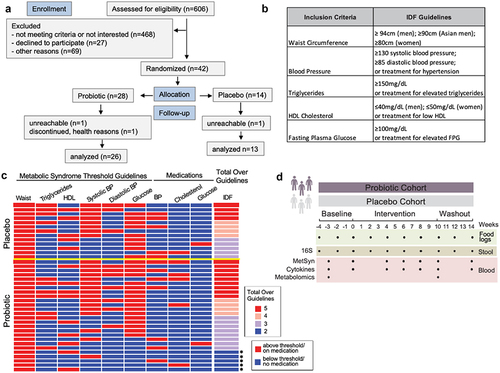
Figure 2. MetSyn parameters did not improve in the probiotic arm, but participants cluster into responder and non-responder groups. (A) MetSyn parameters and (B) alanine aminotransferase (ALT), insulin, and LDL cholesterol at baseline (“B”, week 0) and end of intervention (“W10”, week 10) for probiotic (n=21; participants that had at least 3 elevated parameters and thus met the definition of metabolic syndrome) and placebo arms (n=13). (C) Change from baseline average (weeks -4, -2, 0) to end of intervention (weeks 8, 10) for each participant in placebo, probiotic responder (R), or probiotic non-responder (NR) groups. All probiotic participants (n=26) plotted including those with only 2 elevated parameters ( indicates participants that only satisfied 2 criteria for MetSyn). Each row is a participant and is hierarchically clustered by parameters shown. § indicates significant difference between average baseline and end of intervention within the probiotic responders (paired t-test < 0.05). ‡ indicates significant difference between average percent fold change between probiotic responders and placebo (unpaired t-test < 0.05). † indicates significant difference between average baseline and end of intervention within the probiotic non-responders (paired t-test < 0.05). # indicates significant difference between average percent fold change between probiotic non-responders and placebo (unpaired t-test <0.05). (D) Principal coordinate analysis of Euclidean distances for % change in inflammatory marker from baseline (week -3) to end of intervention (week 10) for all participants. Circles denote 50% confidence level for a multivariate t-distribution. (E) Change in serum homovanillic acid levels from baseline (week -3) to end of intervention (week 10) for placebo, probiotic non-responders (NR), and responders (R) (unpaired t-test, post-hoc p-value = 0.004).
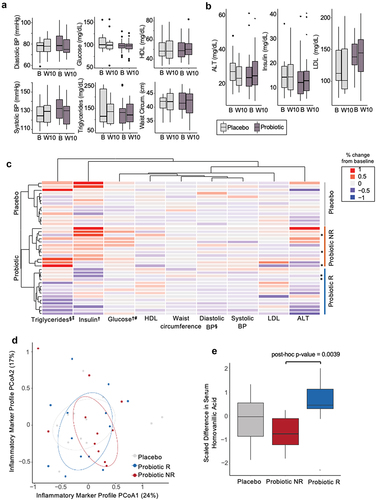
Figure 3. Probiotic responders exhibit distinct microbiome profiles. (a) Within-participant Bray-Curtis distance of amplicon sequenced variants (ASVs) relative to the first baseline time point (week 0) plotted over time by arm (unpaired t-test p values for each time point between arms are shown) (n=13 placebo; n=26 probiotic). (b) Within-participant Bray-Curtis distance, week 0 vs. week 10 by arm and response group (n=14 R; n=12 NR). (c) Bray-Curtis distance of the ASVs for the placebo, probiotic responders and non-responders at the end of the intervention (week 10) are plotted. Circles denote 50% confidence level for a multivariate t-distribution. ASVs driving the separation between groups are depicted as green circles, collapsed to average loading across genus. Size of green circles indicate prevalence (% present across all samples at week 10).
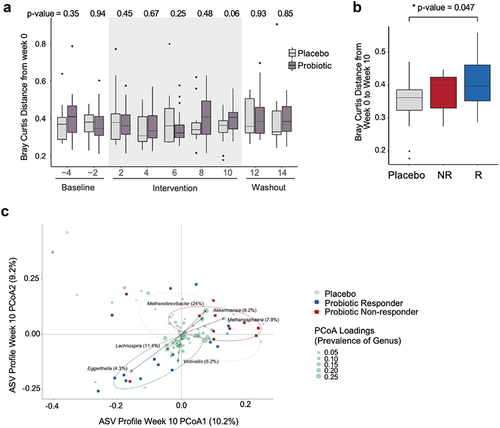
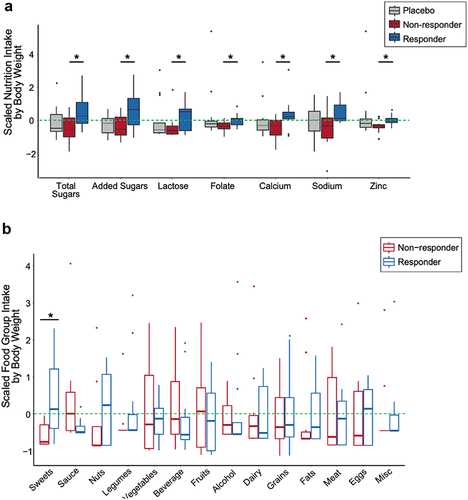
Figure 4. Dietary intake differentiating probiotic responders and non-responders. (A) Nutrients that differ between probiotic responders (n=14) and non-responders (n=12) across the entire study (weeks -4 through 14), normalized by median body weight (kg) (siggenes, FDR < 0.05, q-value < 0.1). Scaled nutrient intake is the mean intake value subtracted from each value and divided by the standard deviation. The line within the box plot represents the median value. (B) Scaled average food group intake (weeks 0 and 10) in which the mean value is subtracted from each value and divided by the standard deviation normalized for median body weight between responders and non-responders (sweets; unpaired t-test, p-value = 0.010). The line within the box plot represents the median value.