Figures & data
Figure 1. Genetic and non-genetic variance components of the microbiome for four highly heritable taxa and one metric of overall microbiome composition from up to 585 baboon subjects measured (A) at one, two, five, ten, and twenty timepoints per subject; and (B) with timepoints grouped by hydrological year, with varying numbers of timepoints per subject across a mean of 220 subjects per year. These data were generated from a data set published as part of.Citation21 Figure 1A emphasizes that increasing the number of samples per subject affects our ability to detect host genetic effects, while Figure 1B shows that the relative contribution of genetic and environmental components to overall microbiome variance can change over time.
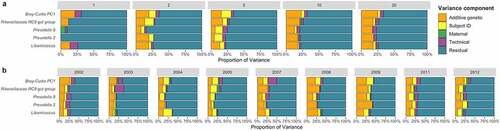
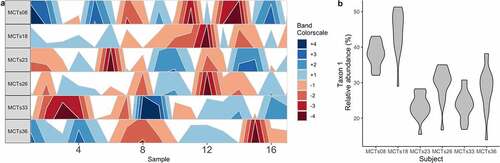
Figure 2. Stability and reproducibility of the microbiome. (A) A horizon plot shows how a taxon’s abundance does not change in consistent ways across time points between individual subjects. Band colors represent quartiles relative to the median. (B) A violin plot depicts the mean ± SD relative abundance of a single taxon in each individual subject, highlighting that stability is personalized. These data are from the demonstration data set from the BiomeHorizon package.Citation47