
Figures & data
Figure 1. SopF inhibits intestinal inflammation to aggravate systemic infection. Streptomycin-pretreated C57BL/6 mice were orally infected with 5 × 10⁷ CFU of STM-WT, STM-ΔsopF or STM-ΔsopF/psopF. (a) Survival curve, n = 7 mice/group. (b) Body weight change, n = 10 mice/group. (c, d) The bacterial loads of livers (i) and spleens (j) at 48 hpi and 120 hpi, each data point represents one mouse. (e) Macroscopic pictures of the intestinal tract at 48 hpi, n = 5 mice/group. (f) Quantification of colon length above. (g) Histopathological analysis of the ceca at 48 hpi and 120 hpi (scale bar: 50 μm), n = 5 mice/group. (h) Total inflammatory score of ceca. (i-k) Gene transcription analysis of Il-6, Tnf-α and Il-1β at 48 hpi and 120 hpi, n = 5 mice/group. Gene expression levels are shown relative to Gapdh. Data were compared by one-way ANOVA. Values are expressed as the means ± SD, and statistically significant differences are indicated. *P < .05, **P < .01, ***P < .001, ns: not significant.
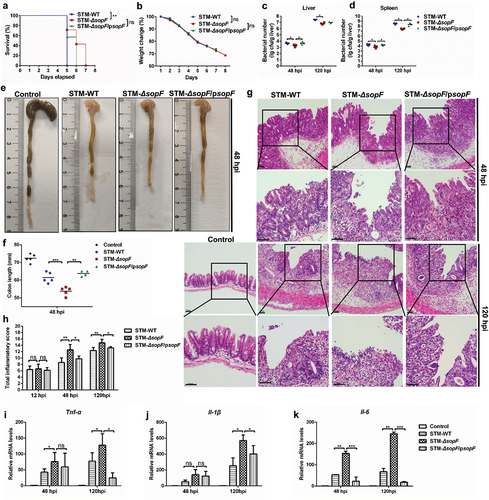
Figure 2. SopF restricts the dislodging of IECs to promote bacterial dissemination. Streptomycin-pretreated C57BL/6 mice were orally infected with 5 × 10⁷ CFU of STM-WT, STM-ΔsopF or STM-ΔsopF/psopF. n = 5 mice/group. (a) Immunofluorescence analysis of EpCAM (red) at 48 hpi and 120 hpi. Nuclei were counterstained with DAPI (blue). White arrowheads indicate epithelial gaps. (Scale bar: 20 μm). (b) Representative images of transmission electron microscopy (TEM) analysis of the ceca at 12 hpi, 48 hpi and 120 hpi (Scale bar: 1 μm). Arrows indicated the bacteria. (c) Distribution of S. Typhimurium (green) in ceca at 12 hpi and 120 hpi. Nuclei were counterstained with DAPI (blue) (Scale bar: 20 μm). Dashed line indicates the end of mucosa. (d) Microscopy-based quantification of epithelial gaps per 10× field of view and IEC numbers per 20× field of view. (e) Quantification of bacterial number in mucosa and submucosa.
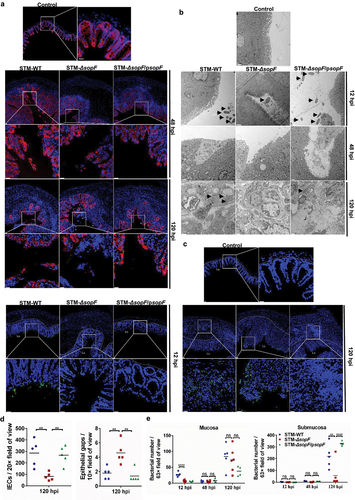
Figure 3. SopF regulates the PANoptosis of intestinal epithelial cells in host defense against S. Typhimurium infection. (a, b) Caco-2 cells (a) or NCM460 (b) cells were infected with STM-WT, STM-ΔsopF or STM-ΔsopF/psopF at an MOI of 100. LDH release were detected at 2 hpi, 8 hpi, 16 hpi and 24 hpi. (c-h) Streptomycin-pretreated C57BL/6 mice were orally infected with 5 × 10⁷ CFU of STM-WT, STM-ΔsopF or STM-ΔsopF/psopF. IECs were isolated from ceca of mice at 12 hpi, 48 hpi and 120 hpi. Western blot analysis of isolated IEC lysates with specific antibodies to (c) GSDMD/GSDMD-NT, GSDME, GSDME-NT; (e) pro-Caspase-3/cleaved Caspase-3; (g) pMLKL and the control Actin. (d, f, h) Quantification of western blot analysis above. (i-h) Caco-2 cells were infected with STM-WT, STM-ΔsopF or STM-ΔsopF/psopF at an MOI of 100 at 24 hpi. Western blot analysis of whole cell lysates with specific antibodies to (i) GSDMD/GSDMD-NT, GSDME, GSDME-NT; (k) pro-Caspase-3/cleaved Caspase-3; (m) pMLKL and the control Actin. (j, l, n) Quantification of western blot analysis above. Data were compared by one-way ANOVA. Values are expressed as the means ± SD, and statistically significant differences are indicated. ***P < .001; **P < .01; *P < .05. Data were from at least three experiments.
Figure 4. SopF inhibits the activation of Caspase-8, a molecular switch for PANoptosis. (a, b) Streptomycin-pretreated C57BL/6 mice were orally infected with 5 × 10⁷ CFU of STM-WT, STM-ΔsopF or STM-ΔsopF/psopF. IECs were isolated from ceca of mice at 12 hpi, 48 hpi and 120 hpi. (c, d) Caco-2 cells (c) or NCM460 cells (e) were infected with STM-WT, STM-ΔsopF or STM-ΔsopF/psopF at an MOI of 100 at 24 hpi. Western blot analysis of isolated IEC lysates (a) or whole cell lysates (c, e) with specific antibodies to pro-Caspase-8 and cleaved Caspase-8. (b, d, f) Quantification of cleaved Caspase-8. Data were compared by one-way ANOVA. Values are expressed as the means ± SD, and statistically significant differences are indicated. ***P < .001; **P < .01; *P < .05. Data were from at least three experiments.
Figure 5. PDK1-RSK signal is required for Caspase-8 blockade during SopF-mediated S. Typhimurium infection. (a, b) Streptomycin-pretreated C57BL/6 mice were orally infected with 5 × 10⁷ CFU of STM-WT, STM-ΔsopF or STM-ΔsopF/psopF. IECs were isolated from ceca of mice at 12 hpi, 48 hpi and 120 hpi. (c) 293 T cells were transfected with an empty vector or pcDNA3.1-SopF-6*His-T2A-GFP for 48 h. (d) Caco-2 cells were infected with STM-ΔsopF carrying an empty vector or a vector expressing SopF: His at an MOI of 100 for 2 hpi and 24 hpi. (c and d) His-tagged SopF were immunoprecipitated from cell lysates and assessed for their ability to bind endogenous PDK1. (e-h) After being pre-treated with mock (DMSO, 1 μL/mL), PDK1 inhibitor (AR-12, 1 μM) or RSK inhibitor (BI-D1870, 10 μM) for 1 h, Caco-2 cells were infected with STM-WT, STM-ΔsopF or STM-ΔsopF/psopF at 24 hpi. Western blot analysis of whole cell lysates with specific antibodies to (e) pro-Caspase-8, cleaved Caspase-8, PDK1 and pRSK; (f) GSDMD/GSDMD-NT, GSDME, GSDME-NT, pro-Caspase-3/cleaved Caspase-3; pMLKL and the control Actin. (g, h) Quantification of western blot analysis above. Data were compared by one-way ANOVA. Values are expressed as the means ± SD, and statistically significant differences are indicated. ***P < .001; **P < .01; *P < .05; ns: not significant. Data were from at least three experiments.
Figure 6. Schematic diagram of SopF regulated PANoptosis during S. Typhimurium infection. SopF, a PIP binding effector, inactivates Caspase-8 through PDK1-RSK signaling. The blockade of Caspase-8 down-regulates the cleavage of GSDMD, GSDME and Caspase-3, but up-regulates the phosphorylation of MLKL. These signaling cascade explain the mechanism by which diminished pyroptosis and apoptosis, but facilitated necroptosis. PDK1 inhibitor (AR-12) and RSK inhibitor (BI-D1870) overcome Caspase-8 blockade and restore the IECs PANoptosis. The SopF-halted pyroptosis and apoptosis prevents the expulsion of infected IECs, whereas the SopF-induced necroptosis enables S. Typhimurium per se spread into lamina propria. This event presented by SopF ameliorated intestinal inflammatory to aggravate systemic infection. PIP, phosphoinositide; PDK1, phosphoinositide-dependent protein kinase-1; RSK, phosphorylate p90 ribosomal S6 kinase; GSDMD, gasdermin D; GSDME, gasdermin E; MLKL, mixed lineage kinase domain-like; IECs, intestinal epithelial cells.
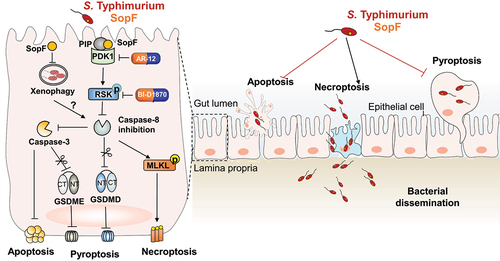
Table 1. Primers used for construction and identification of strains.
Table 2. Primer sequences for quantitative PCR.
Supplemental Material
Download Zip (504.8 KB)Data availability statement
The data supporting the findings are openly available at https://doi.org/10.6084/m9.figshare.21813894.v1.