Figures & data
Figure 1. Study cohort and prevalence of sustained disability worsening, using the EDSS-Plus endpoint. (a) The cohort consisted of 111 MS patients (86 relapsing-remitting (RR), 25 primary progressive (PP)). At baseline, patients were either disease-modifying treatment naïve (RRMS N = 33, PPMS N = 21), untreated (RRMS N = 26, PPMS N = 4), or treated with interferon-β (IFN-β, RRMS N = 27). (b) EDSS-Plus worsening was observed in 39/95 patients (RRMS N = 29/73, PPMS N = 10/22; undetermined in 16 patients) and was not associated with onset (χ2 test; N = 95, χ2 = 0.23, false-discovery rate (FDR) adjusted P value = .89). (c) Distribution of treatment groups was similar in patients with and without worsening (IFN-β N = 11/39 & N = 15/56; untreated N = 8/39 & N = 18/56; naïve N = 20/39 & 23/56, respectively) (χ2 tests; N = 95, 1.68, FDR = 0.72). n.s. = non-significant.
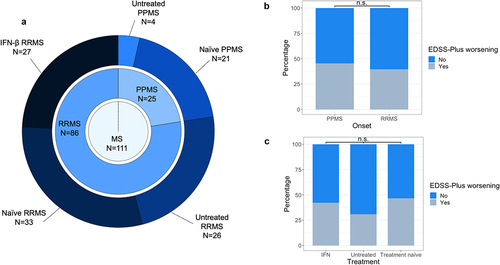
Table 1. Description of study participants.
Figure 2. Baseline enterotype is associated with sustained worsening as defined with EDSS-Plus. (a, d) Enterotype distribution was significantly different between patients with and without EDSS-Plus worsening (χ2 tests; χ2 = 11.20, N = 95, P = .009 for total MS group; χ2 = 13.18, N = 73, P = .003 for relapsing-remitting (RR) MS group), even after partialling out effects of timed 25-foot walk (T25FW) and nine-hole peg test (9-HPT, non-dominant) scores (Generalized Linear Models (GLMs); N = 89, R2 enterotype = 0.16, P = .001 for total MS group; N = 69, GLM, R2 enterotype = 0.19, P = .015 for RRMS group). (Bacteroides 1 (Bact1) N = 38 & N = 32, Bacteroides 2 (Bact2) N = 26 & N = 18, Prevotella (Prev) N = 8 & N = 5, Ruminococcaceae (Rum) N = 23 & N = 18 for total MS group and RRMS group, respectively) (b, e) Group distribution was significantly different between Bact2 and non-Bact2 enterotypes (χ2 tests; N = 95, χ2 = 8.76, P = .003 for total MS group; N = 73, χ2 = 13.18, P = .003 for RRMS group). (c, f) ROC (receiver operating characteristic) curve of the logistic regression models (with area under the curve (AUC)) with (red) and without (black) enterotype to predict sustained worsening with the EDSS-Plus (N = 95 and N = 73 for total MS group and RRMS group, respectively). (g) No association between enterotype at baseline and sustained worsening as defined with EDSS-Plus was found for primary progressive (PP) MS (χ2 test, N = 22, χ2 = 1.03, P = .832). (h) No significant difference in enterotype distribution (at baseline) between onsets was found (χ2 test, N = 95, χ2 = 2.96, P = .404). (i) The Bact2 enterotype is more prevalent in interferon-β- (IFN-β) treated RRMS than untreated and naïve (UNTR/NAI) RRMS (χ2 test, χ2 = 4.82, N = 95, P = .04). The percentage of Bact2-enterotyped individuals within the IFN-β-treated RRMS group (N = 25/95) and untreated RRMS group (N = 48/95) was 40% and 16.7%, respectively. n.s. = non-significant.
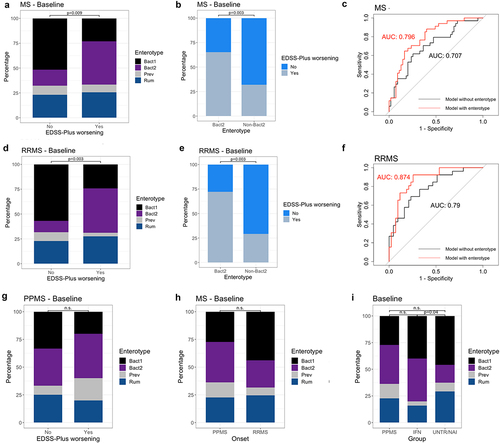
Figure 3. Gut microbial composition is similar at baseline and 3 months post-baseline. (a–c) Box plots representing differences in observed richness, Inverse Simpson’s and Pielou indices between baseline and 3 months post-baseline for each participant. Indices were similar in all groups for both visits (Wilcoxon signed-rank, for relapsing-remitting (RR)MS N = 84, effect size = −0.088, −0.007, −0.111, respectively, false-discovery rate (FDR) adjusted P value = .89, 0.95, 0.89 respectively; for primary progressive (PP)MS N = 24, effect size = −0.49, −0.06, −0.032 respectively, FDR = 0.10, 0.89, 0.95, respectively). Microbial load measurements were unavailable for 3/111 samples, with quantitative microbiota profiles (QMP) thus missing for these participants. (d) Principal coordinates analysis (PCoA) on QMP genus-level matrix (Bray–Curtis dissimilarity) of cohort (RRMS N = 84, PPMS N = 24). No major shifts in global community structure were observed between visits (permutational MANOVA Adonis, N = 108, n = 216 samples, adjusted R2 = 0.003, P = .852). (e) Bray–Curtis distance between baseline and 3 months post-baseline samples for each participant. Variation in distance was similar in all groups (Kruskal–Wallis, N = 111, χ2 = 1.07, P = .30). The box plot body represents the first and third quartiles of the distribution and the median line. Whiskers extend from quartiles to the last data point within 1.5× the interquartile range, outliers lie beyond. n.s. = non-significant.
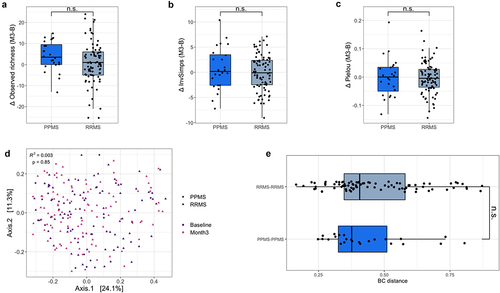
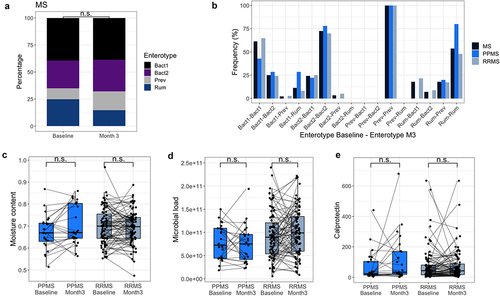
Figure 4. Enterotypes and distinct stool characteristics are similar at baseline and 3 months post-baseline. (a) Bar plots representing enterotype distribution (based on relative microbiota profiles (RMP)) per visit. Enterotype distribution was similar in MS patients at both visits (χ2 test, MS N = 111, χ2 = 3.73, P = .29). (b) Bar plots representing the frequency of enterotype switches between baseline and 3 months post-baseline for the total MS population, PPMS, and RRMS. In the MS group, enterotypes were found to be stable between visits (McNemar–Bowker, N = 111, χ2 = 9.98, P = .12; sample size of subgroups proved too small for separate testing), although multiple transitions toward the Bact2 enterotype occurred that seemed to be linked to oral antibiotic usage between time points. (Bact: Bacteroides; Prev: Prevotella, Rum: Ruminococcaceae) (c, d, e) No significant difference in moisture content, fecal calprotectin levels, and microbial load was found between baseline and 3 months post-baseline for primary progressive (PP)MS and relapsing-remitting (RR)MS (Wilcoxon signed-rank, for RRMS N = 84, effect size = −0.065, −0.064, −0.145 respectively, false-discovery rate (FDR) adjusted P value = .56, 0.56, 0.55, respectively; PPMS = 24, effect size = −0.381, −0.184, −0.154, FDR = 0.37, 0.56, 0.56, respectively). The box plot body represents the first and third quartiles of the distribution and the median line. Whiskers extend from quartiles to the last data point within 1.5× the interquartile range, outliers lie beyond. n.s. = non-significant.