
Figures & data
Figure 1. Obesogenic diet boosted ILC1s in the gut and adipose tissue expansion countered by ILC1s depletion (a) Schematic representation of the experimental design. (b–d) ILC1s (percentage of LIN− cells of total intestinal epithelial cells) in the small intestine at 4 weeks, 10 weeks, and 14 weeks, respectively (n = 5–8). (e) Weight of epididymal and inguinal white adipose tissue (eWAT and iWAT, respectively) (n = 8). (f) adipocyte area (n = 8) and representative images of the histological staining of visceral adipose tissue (8×). (g) Expression of markers of fatty acid uptake and adipogenesis, Lpl, Cd36 and Cebpb (n = 7–8). (h,i) Plasma resistin levels and correlation between resistin levels and eWAT content (n = 7–8). Bars represent the mean ± SEM and biological replicates are shown as individual dots. For normally distributed data statistical analyses were performed by t-test or ANOVA, as appropriate, followed by post hoc Tukey’s multiple comparison test. Welch’s correction was applied when variances were not equally distributed. Non-normally distributed data were analyzed with the Mann-Whitney or Kruskal-Wallis test (as appropriate) followed by Dunn’s multiple comparisons test. Correlations were calculated with Pearson’s test. “*” p < .05. Data with different superscript letters are significantly different at p < .05.
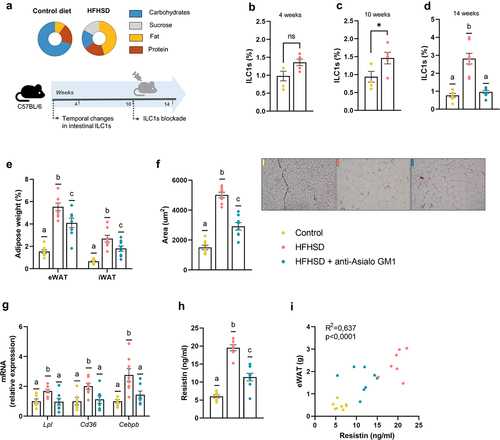
Figure 2. Depletion of intestinal ILC1s improved gut homeostasis. (a) Pro-inflammatory macrophages (M1) (b) ratio of M1/M2 macrophages (n = 8) in the small intestine. (c,d) ILC2s and ILC3s (percentage of LIN− cells of the total lamina propria cells) in the small intestine (n = 7–8). (e,f) Plasma levels of IL-22 and IL-17A (n = 5–8). (g) Ileal gene expression of antimicrobial peptides (Reg3g, and Pla2g2a), the Paneth differentiation marker Tcf4 and, (h) tight junction markers (Ocln, Cldn3 and Zo1). (i) Colonic expression of Muc2, and (j) representative images of the histological staining of the colonic tissue with alcian-blue and quantification of mucus production as the area of mucus relative to the area of the total mucosa. Bars represent the mean ± SEM and biological replicates are shown as individual dots. Statistical analyses were performed by ANOVA followed by post hoc Tukey’s multiple comparison test for normally distributed data. Welch’s correction was applied when variances were not equally distributed. Non-normally distributed data were analyzed with the Kruskal-Wallis test followed by Dunn’s multiple comparisons test. Data with different superscript letters are significantly different at p < .05.
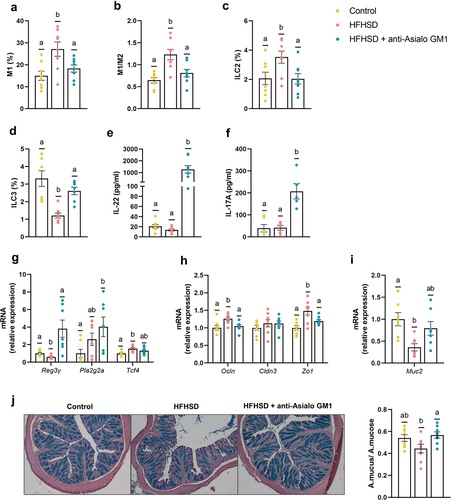
Figure 3. Depletion of ILC1s influenced enteroendocrine control. (a) Immunolabeling of ileal sections and the number of immune-positive neuroendocrine cells per mucosa area (n = 8). (b) Plasma levels of the hormones PYY (n = 7–8), (c) total GLP-1 (d) and active GLP-1 (n = 6–8), and (e) total GLP-2, (f) DPP4 activity in plasma and in (g) visceral adipose tissue (n = 6–8). (h) Insulinemia (n = 6–8) and (i) HOMA-IR index (n = 6–8). Bars represent the mean ± SEM and biological replicates are shown as individual dots. Statistical analyses were performed by ANOVA followed by post hoc Tukey’s multiple comparison test for normally distributed data. Welch’s correction was applied when variances were not equally distributed. Non-normally distributed data were analyzed with the Kruskal-Wallis test followed by Dunn’s multiple comparisons test. Active GLP-1 was analyzed by Chi-square contingency tests. Data with different superscript letters or the symbol “*” show significant differences at p < .05.
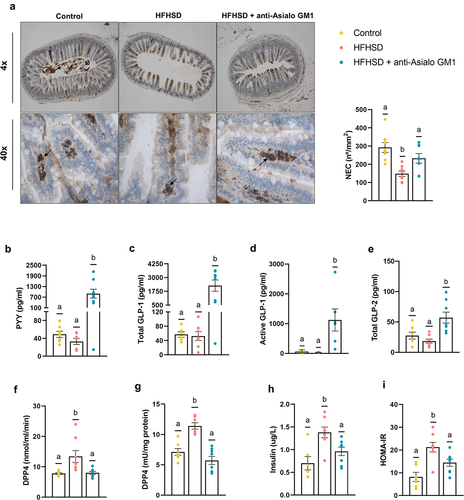
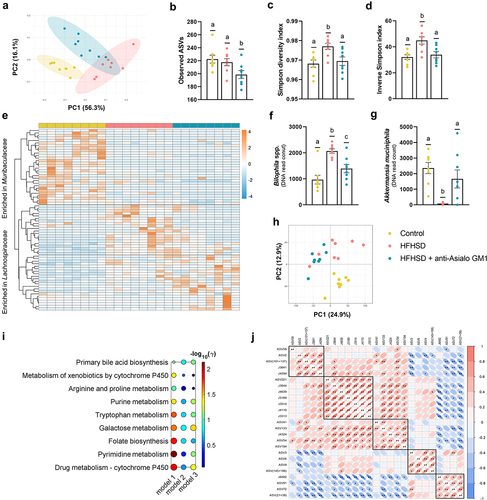
Figure 4. Depletion of intestinal ILC1s shaped the gut microbiome and the metabolic signature. (a) Beta-diversity based on weighted UniFrac distances. (b) Observed ASVs. (c, d) Simpson’s diversity and evenness indexes. (e) Heat-map representing the clustering of the two more abundant families (Muribaculaceae and Lachnospiraceae). (f) Bilophila spp. and (g) Akkermansia muciniphila abundance. (h) Principal component analysis based on metabolomic data. (i) Scheme of the altered pathways between HFHSD-fed animals and HFHSD-fed mice depleted for ILC1s (model 1: HFHSD vs HFHSD anti-Asialo GM1; model 2: control diet vs HFHSD anti-Asialo GM1; model 3: control diet vs HFHSD), and (j) correlations between the ASVs and the metabolites significantly different between HFHSD vs HFHSD anti-Asialo GM1. ASV59: Lachnospiraceae NK4A136 group; ASV2: Bilophila; ASV (101 + 137): Colidextribacter; J3641: uridine; J4294: glucosiduronic acid; ASV221: Lachnospiraceae GCA-900066575; J3644: Fatty acid; J4639: D-maltose; J3189: suberic acid; J3514: sedanonic acid; J4110: quesitol; J3513: traumatic acid; ASV41: Oscillospiraceae; ASV133: Oscillospiraceae UCG-003; J4324: Fatty acyls; ASV54: Lachnospiraceae NK4A136 group bacterium; ASV194: Lachnospiraceae A2; ASV3: Akkermansia muciniphila; ASV6: Rikenellaceae RC9 gut group; ASV4: Lachnospiraceae NK4A136 group bacterium; ASV (145 + 188): Ruminococcaceae; J6482: rutin; ASV91: Coriobacteriaceae UCG-002; ASV72: Parasutterella; ASV (21 + 39): Bacteroides. In all cases, n = 8. Bars represent the mean ± SEM and biological replicates are shown as individual dots. Pathway analysis was carried out using the mummichog algorithm with a p-value cutoff of 0.05 and the human KEGG pathway database.
Supplemental Material
Download Zip (923.1 KB)Data availability statement
The sequences corresponding to the analyses of the gut microbiota composition are uploaded in the ENA (project number PRJEB53615; https://www.ebi.ac.uk/ena/browser/view/PRJEB53615). The non-targeted metabolic data used in this study is available in the Zenodo repository (https://zenodo.org/record/7104987#.Y_OwfR_MJdg, doi:10.5281/zenodo.7104987).