
Figures & data
Figure 1. Physiological tests of the testosterone-grown strain GDN1. (a) denitrifying growth of several androgen-catabolic anaerobes with testosterone at 28°C and 37°C. The anaerobic androgen utilization of comamonas testosteroni strain TA441, a betaproteobacterium capable of aerobic androgen catabolism, was also tested for a comparison. (b) Nitrate is required for anaerobic androgen catabolism of strain GDN1. androgenic activity in bacterial cultures was determined using a yeast androgen bioassay. (c) aerobic androgen catabolism of strain GDN1. results are the representative of three individual experiments. all data are shown as means ± SEM. statistical results were calculated using welch’s t-test; ***p<0.001.
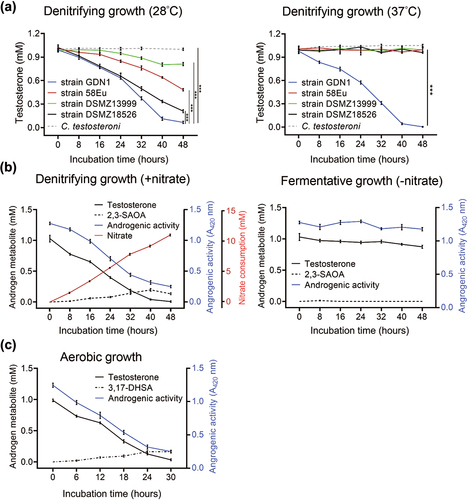
Figure 2. Steroid utilization patterns of strain GDN1. The bacterial cultures of autoclaved strain GDN1 cells were used as negative controls. androgen metabolites were detected and quantified through UPLC – ESI–HRMS. results are the representative of three individual experiments. all data are shown as mean ± SEM. statistical results were calculated using unpaired nonparametric t-test; *p<0.05. abbreviations: androstadienedione, ADD; dihydrotestosterone, DHT.
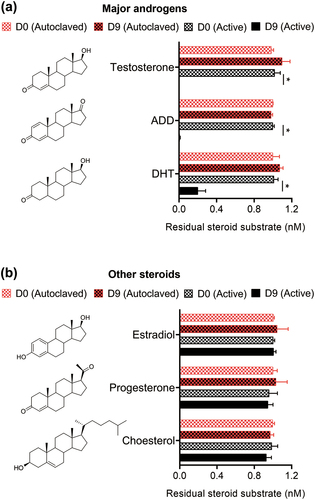
Figure 3. Identification and expression of androgen catabolism genes of strain GDN1. (a) gene synteny of androgen catabolism in the strain GDN1 chromosome (accession no.: CP097870). strain GDN1 uses the gene products of atcABC and kshAB to catabolize androgen anaerobically and aerobically, respectively. ORFs homologous between different bacterial strains are connected by columns with different gray scaling, according to the similarities of deduced amino acid sequences. numbers below individual ORFs of strain GDN1 indicate the gene expression ratios, which are derived from the logarithmic transformation of differential gene expression levels of strain GDN1 grown with acetate (abbreviation: A) or testosterone (abbreviation: T) under aerobic and anaerobic (denitrifying) conditions. Androgen catabolism genes are named according to those characterized in two androgen-degrading bacteria: Comamonas testosteroni strain CNB-2 (aerobic androgen degrader) and thauera terpenica 58eu (anaerobic androgen degrader). synteny analysis was conducted using clinker v0.023 (https://github.Com/gamcil/clinker). (b) global gene expression profiles (RNA-Seq) of strain GDN1 grown under different conditions [anaerobic growth with testosterone or acetate (left panel); anaerobic or aerobic growth with testosterone (right panel)]. each spot represents a gene. gene expression levels were estimated using fragments per kilobase of transcript per million mapped reads (FPKM).
![Figure 3. Identification and expression of androgen catabolism genes of strain GDN1. (a) gene synteny of androgen catabolism in the strain GDN1 chromosome (accession no.: CP097870). strain GDN1 uses the gene products of atcABC and kshAB to catabolize androgen anaerobically and aerobically, respectively. ORFs homologous between different bacterial strains are connected by columns with different gray scaling, according to the similarities of deduced amino acid sequences. numbers below individual ORFs of strain GDN1 indicate the gene expression ratios, which are derived from the logarithmic transformation of differential gene expression levels of strain GDN1 grown with acetate (abbreviation: A) or testosterone (abbreviation: T) under aerobic and anaerobic (denitrifying) conditions. Androgen catabolism genes are named according to those characterized in two androgen-degrading bacteria: Comamonas testosteroni strain CNB-2 (aerobic androgen degrader) and thauera terpenica 58eu (anaerobic androgen degrader). synteny analysis was conducted using clinker v0.023 (https://github.Com/gamcil/clinker). (b) global gene expression profiles (RNA-Seq) of strain GDN1 grown under different conditions [anaerobic growth with testosterone or acetate (left panel); anaerobic or aerobic growth with testosterone (right panel)]. each spot represents a gene. gene expression levels were estimated using fragments per kilobase of transcript per million mapped reads (FPKM).](/cms/asset/de446634-3653-4aec-b021-1cbabcc44396/kgmi_a_2183685_f0003_oc.jpg)
Figure 4. Administration of androgen-catabolic Thauera sp. strain GDN1 into mouse gut through oral gavage can regulate host circulating androgen levels. (a) Working flow of the administration of mice with strain GDN1 through oral gavage. Nitrate (2 mM) was supplemented in the drinking water during the period of continuous administration. (b) Administration of male mice with strain GDN1 through oral gavage for 25 days reduces serum testosterone levels considerably. (c) Strain GDN1 administration does not affect the serum androgen metabolite profiles of male and female mice considerably. Testosterone is the most dominant serum androgen (>90%, w/w) in all the included mice. Results are representative of three individual experiments. Statistical results were calculated with unpaired nonparametric t-test; *p<0.05, ***p<0.001. All data are shown as means ± SEM of 8–14 mouse individuals.
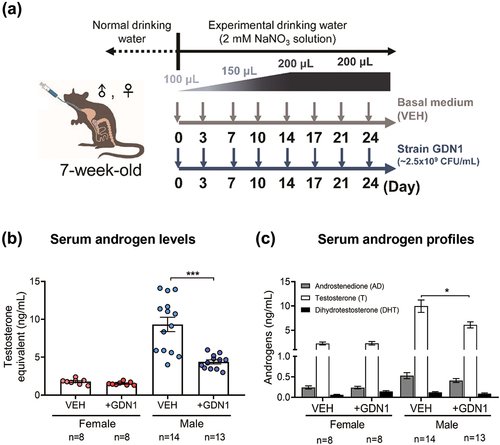
Figure 5. Determination of the abundance and relative expression of Thauera genes in the mouse GI tract. (a) determination of Thauera 16S rRNA copy number in the mouse GI contents using qPCR. all data are shown as means ± SEM of 5 randomly selected male mice. statistical results were computed with unpaired nonparametric t test; *p<0.05. (B – D) determination of relative expression of strain GDN1-specific 16S rRNA (b), atcA (c), and kshA (d) in the mouse GI contents using RT-qPCR. relative change in gene expression was calculated using the 2−ΔΔCt method with the Ct value of universal 16S rRNA of bacteria as the internal control. The expression of individual genes in the vehicle-administered mouse ileum was set as 1. results are representative of three individual experiments. statistical results were calculated with unpaired nonparametric t-test; *p<0.05, **p<0.01. all the data are shown as mean ± SEM of 5 randomly selected male mice. #, expression of inherent atcA-like gene (see appendix S4 for nucleotide sequence).
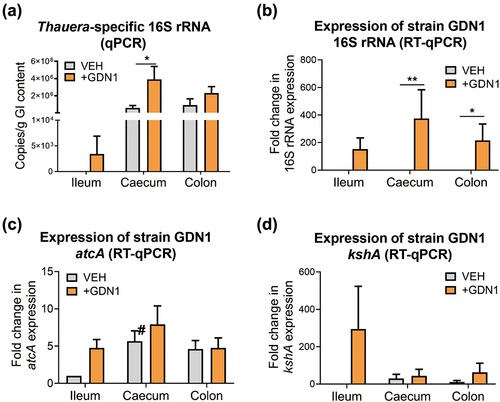
Figure 6. Anaerobic growth of fecal bacteria from the strain GDN1-administered mice (abbreviation: GDN1) or vehicle-administered mice (VEH) mice with testosterone (1 mM; set as 100%) as sole carbon source. after 25 days of continual administration, the fresh mouse feces (approximately 0.1 g) were collected and immediately incubation with testosterone in a denitrifying medium, and the temporal changes in substrate consumption and the copy number of Thauera 16S rRNA in bacterial cultures was determined. The residual testosterone concentration was examined using HPLC. The copy number of Thauera 16S rRNA was determined through qPCR.
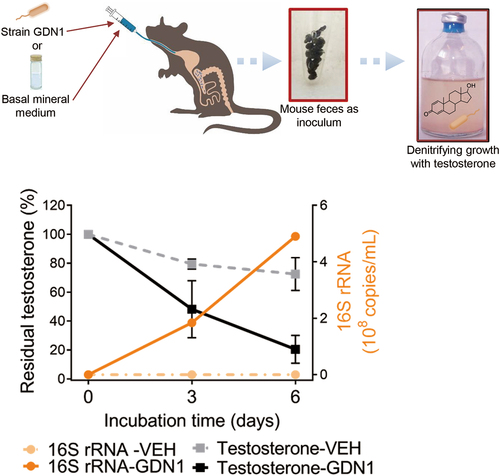
Figure 7. Impact of strain GDN1 administration on mouse gut microbiota. (a) Gut bacterial communities across the mouse treatments. NMDS analysis based on Bray-Curtis distance matrix data (genus level) was used to determine the similarities between the gut bacterial communities from different mouse treatments, including the vehicle-administered male mice (VM), strain GDN1-administered male mice (GM), vehicle-administered female mice (VF), and strain GDN1-administered female mice (GF). numbers shown are the days after the first oral administration. (b) relative abundances of the most prevalent bacterial phyla (bar length) in the mouse fecal samples. (c) relative abundance changes of major bacteria families in the fecal samples from different mouse treatments. Bacterial phyla: ocher, Firmicutes (F); green, Bacteroidetes (B); purple, Actinobacteria (A); light blue, Verrucomicrobiota (V); Dark blue, Proteobacteria (P).
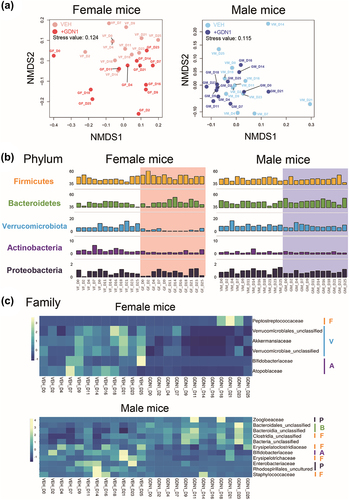
Figure 8. The microbial interaction networks identified in the female (A) and male (B) mice. potential microbial interactions were predicted using SparCC. nodes represent microbial genera, and only high-scoring eigenvector centrality nodes (top 30) are shown. eigenvector centrality is indicated by node size and color; a larger round node with a darker red hue corresponds to a higher value of eigenvector centrality. conversely, a smaller round node with a bright yellow hue corresponds to a lower value of eigenvector centrality. A node with the highest eigenvector centrality (rank 1, which is highly interacting with other nodes) may play a pivotal role in the network. A red edge depicts a positive interaction, whereas a blue edge depicts a negative interaction.
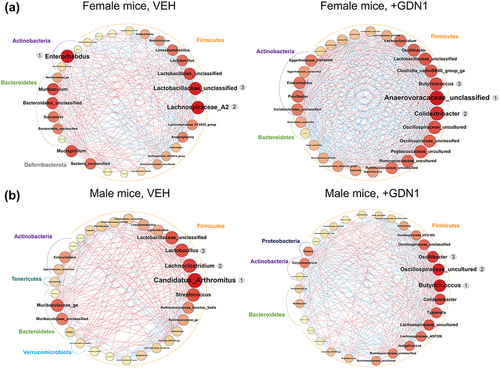
Figure 9. UPLC – ESI–HRMS detection of (A) 2,3-SAOA (anaerobic ring-cleaved metabolite) and (B) 3,17-DHSA (aerobic ring-cleaved metabolite) in the fecal extract of male mice administered with strain GDN1. Aforementioned ring-cleaved metabolites were not detected in the vehicle-administered mice. Fresh mouse feces were sampled 2 weeks after the first oral administration and was stored at−80°C before use. The fecal samples were extracted using ethyl acetate, and the androgen metabolites were analyzed through UPLC – ESI–HRMS. The predicted elemental composition of individual metabolite ions was calculated using MassLynx Mass Spectrometry Software (Waters); *unidentified metabolite.
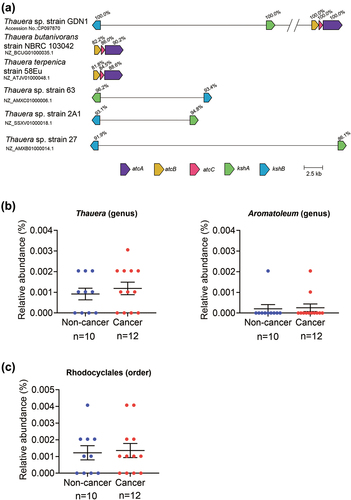
Figure 10. The prevalence of androgen catabolic bacteria in the human gut. (A) the distribution of the androgen catabolic genes kshAB and atcABC in the Thauera genomes. The cblaster software was used to search and visualize collocated protein-coding regions of androgen catabolic gene synteny in the Thauera RefSeq genomes. (B) the abundance of the genus Thauera and Aromatoleum (potential androgen degraders) in the prostatic cancer patients (n = 12) and healthy males (n = 10). (C) the abundance of the bacterial order Rhodocyclales (potential androgen degraders) in the prostatic cancer patients and healthy males. All data are shown as means ± SEM. The significance was calculated using unpaired nonparametric t-test.
Supplemental Material
Download Zip (4.5 MB)Data availability statement
Oligonucleotide primers used in this study are listed in Table S2. Nucleotide sequences of the 16S rRNA and androgen catabolism genes of strain GDN1 are shown in Appendices S1–S3. Transcriptomic data of the strain GDN1 are available in Dataset S1. Genome sequence of the strain GDN1 (accession no. CP097870) has been deposited in the National Center for Biotechnology Information (NCBI) Genome database. The transcriptomes of the strain GDN1 have been deposited in the NCBI SRA database under BioProject ID PRJNA838737 [accession numbers: SRR19418054~ SRR19418057]. The fecal bacterial 16S rRNA sequencing datasets have been deposited in the NCBI SRA database under BioProject ID PRJNA838737 [accession numbers: SRR19913488~SRR19913535].