Figures & data
Figure 1. Cecum Axis (CecAx) preservation maintains both the ampulla-apex and mesentery-antimesentery axis and reveals histological gradients in epithelial crypt depth. A) Schematic of the mouse cecum with the ampulla, body, and apex of the cecum depicting the vascular bed attached to the mesenteric lesser curvature opposite from the antimesenteric greater curvature. B) Photograph of a faced tissue block showing formalin-fixed paraffin-embedded mouse cecum. C) Stitched brightfield microscopy images of H&E-stained mouse cecum show how the CecAx preservation technique yielded well-oriented tissue sections with respect to both epithelial crypts and organ anatomy. Arrowheads show examples of transverse folds. D) Individual measurements of crypt depth and distance from the mesentery in both the ampulla and apex of wild-type C57Bl/6J mice. The plot shows a negative correlation between depth and distance from the mesentery and shows that crypts were deeper in the ampulla compared to the apex. Crypts next to GALT are excluded (n = 5 mice; colors represent individual mice, Spearman’s rank correlation rho with p-value shown).
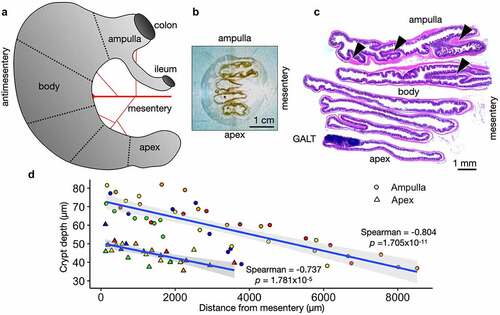
Figure 2. Imaging mass spectrometry of normal mouse cecum shows anatomic gradients of metabolites. A) the cecum ampulla (left) and apex (right) of a healthy adult C57Bl/6J mouse are shown after flash freezing and partial embedding in OCT. The mesenteric side is oriented to the right. B) Images of H&E stained serial mouse ceca sections with identical orientation to the sections imaged via imaging mass spectrometry in D. C) Averaged spectral intensities for 5 ampulla (black, top) and 5 apices (red, bottom). The inset shows a narrow portion of the averaged spectra for 279.233 Da. D) Heatmap showing spatial distribution of the intensity of a signal at m/z 279.233 Da, which putatively represents linoleate. a.i. = arbitrary intensity, m/z = mass/charge.
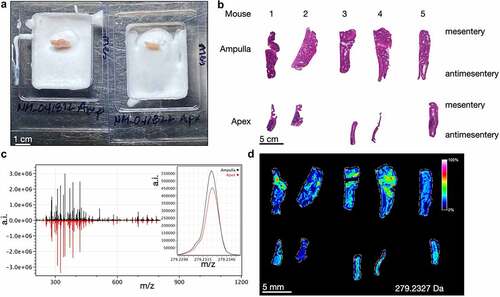
Figure 3. Difficile infection induces a gradient of edema and inflammation along the mesentery-antimesentery axis. A) Quantification of edema during C. difficile infection. Each point represents the average edema area at the mesentery and antimesentery from one mouse, n = 8. B) H&E images depicting edema area (asterisks, *) at the mesenteric and antimesenteric border. C) Quantification of inflammatory infiltration as measured by the number of myeloid cells (predominantly neutrophils) in the lamina propria per HPF (20×). Each point represents the average number of lamina propria myeloid cells at the mesentery and antimesentery from one mouse, n = 8. D) Immunofluorescence microscopy images show double-positive (orange represents the colocalization of F4/80 and neutrophil elastase staining) myeloid cells in the lamina propria. p-values shown from paired Wilcoxon signed-rank exact test.
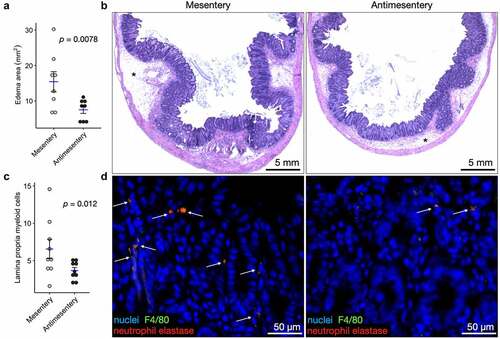
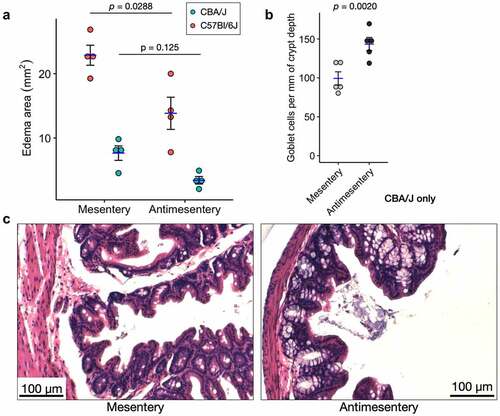
Figure 4. Two different S. Tm infection models show differential pathology along the mesentery-antimesentery axis. A) Quantification of edema area as measured in for C57Bl/6J and CBA/J models of S. Tm infection, n = 4 mice for each model. p-values are shown from a paired, two-tailed T-test. B) Quantification of goblet cell number shows higher average abundance at the antimesentery compared to mesentery of CBA/J mice, n = 5 mice. Because crypt depths are variable, we normalized the number of goblet cells per mm of their resident crypt depth. p-value shown from paired Wilcoxon signed-rank exact test. C) H&E images from S. Tm-infected CBA/J mice depicting differences in goblet cell density.