Therapeutic potential of Clostridium butyricum anticancer effects in colorectal cancer
Hui XuGuangdong Institute of Gastroenterology, Guangdong Provincial Key Laboratory of Colorectal and Pelvic Floor Diseases, The Sixth Affiliated Hospital, Sun Yat-sen University, Guangzhou, Guangdong, ChinaView further author information
,
Haidan LuoGuangdong Institute of Gastroenterology, Guangdong Provincial Key Laboratory of Colorectal and Pelvic Floor Diseases, The Sixth Affiliated Hospital, Sun Yat-sen University, Guangzhou, Guangdong, ChinaView further author information
,
Jiayu ZhangGuangdong Institute of Gastroenterology, Guangdong Provincial Key Laboratory of Colorectal and Pelvic Floor Diseases, The Sixth Affiliated Hospital, Sun Yat-sen University, Guangzhou, Guangdong, ChinaView further author information
,
Kai LiGuangdong Institute of Gastroenterology, Guangdong Provincial Key Laboratory of Colorectal and Pelvic Floor Diseases, The Sixth Affiliated Hospital, Sun Yat-sen University, Guangzhou, Guangdong, ChinaView further author information
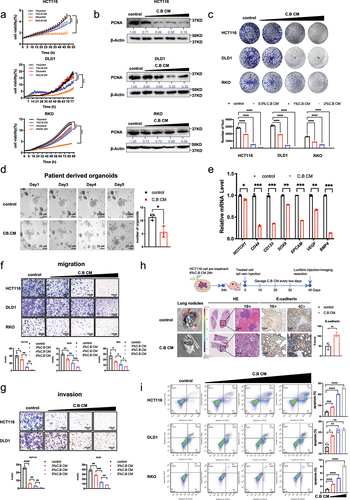
Figure 1. Clostridium butyricum regulates cell proliferation, migration and invasion, patient derived organoid (PDO) growth, and metastasis in CRC.
(a) The growth curves of CRC cells treated with indicated concentrations of C.B CM (1%, 3% C.B CM for HCT116 and DLD1 cells, 1% and 5% C.B CM for RKO cells). Growth were measured by IncuCyte machine.
(b) Immunoblot analysis of PCNA protein expression in CRC cells (HCT116, DLD1 and RKO cells) treated with indicated concentrations of C.B CM. β-Actin was used as the internal control.
(c) Colony formation assay after treatment with indicated concentrations of C.B CM (0.5%, 1%, 2%) in CRC cells. The medium was changed every five days.
(d) Bright-field images and quantification of CRC patient-derived organoids after treatment with 1.5% culture medium or 1.5% C.B CM for 5 days. Scale bar: 25 μm.
(e) qRT-PCR analysis was performed to measure the mRNA levels of indicated stemness markers in HCT116 cells after treatment with or without 6%C.B CM.
(f) Transwell assays show the effects of treatment with indicated concentrations of C.B CM for 24 h CRC cells on the ability of cell migrations in CRC cells. Scale bar: 100 μm.
(g) Transwell assays show the effects of treatment with indicated concentrations of C.B CM on CRC cells for 24 h for the ability of cell invasions. Scale bar: 100 μm.
(h) Schematic overview of the intravenous metastatic dissemination assay via tail vein. HCT116-Luc tumor cells were treated with 6% C.B CM for 24 h before intravenous injection into BALB/c-nu mice (1 × 10⁶ cells per 200 µl per injection). IVIS imaging from lungs after luciferin injection on day 40 after tumor cell injection. HE and E-cadherin staining were performed. Scale bar: 10×, 100 μM; 40×, 25 μM.
(i) Flow cytometry analysis of apoptotic cells in CRC cells treated with different concentrations of C.B CM (3%, 4%, 5% C.B CM for HCT116 cells, 3%, 5% and 6% for DLD1 cells, 4%, 6% and 8% for RKO cells). Data are presented as mean ± SEM. ns, no significance; *, p < 0.05; **, p < 0.01; ***, p < 0.001; two-way ANOVA test, unpaired two-tailed Student test and one-way ANOVA test.
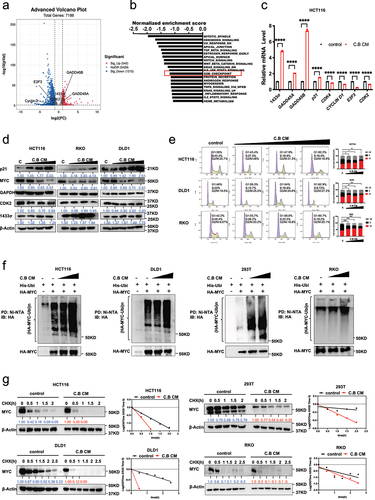
Figure 2. C.B instigates MYC ubiquitination and destabilization in regulating CRC progression.
(a) The volcano plot of differential gene expression in control and C.B CM-treated HCT116 cells (|logFC| > 0.5 and p-value<0.05).
(b) Representative top 20 pathways enriched in control group compared to C.B CM group based on GSEA analysis results.
(c) qRT-PCR analysis was performed to measure the mRNA levels of indicated cell cycle related genes after treatment with or without 6%C.B CM.
(d) Immunoblot analysis show the protein expressions of indicated cell cycle related proteins in CRC cells treated with increasing concentration of C.B CM (3%, 4% and 6% for HCT116, 3%, 4%, 5%, 6% for DLD1 cells, 4%, 5% and 6% for RKO).
(e) Flow cytometry analysis of cell cycle distribution of CRC cells upon C.B CM treatment. Cell cycle distribution in cells treated with different concentrations of C.B CM (3%, 4%, 5% for HCT116 cells, 4%, 5% and 6% for DLD1 cells, 3%, 4% and 6% for RKO cells) for 24 h was analyzed.
(f) Immunoblot analysis of ubiquitinated MYC protein in indicated cells treated with increasing concentration of C.B CM (3% and 6%) for 24 h. RKO was treated with C.B CM (4% and 8%). Cells were co-transfected with His-Ubi and HA-MYC plasmids. MG132 was added to the cells 6 h before they were harvested. The cell lysates were pulled down with Ni-NTA beads and immunoblotted with anti-HA antibody.
(g) The turnover rate of the c-Myc protein in indicated cells after treatment with 3%C.B CM for 24 h. RKO was treated with 4% C.B CM. CHX: cycloheximide, IOD: integrated optical density. Data are presented as mean ± SEM. ns, no significance; *, p < 0.05; **, p < 0.01; ***, p < 0.001; unpaired two-tailed Student test and two-way ANOVA test.
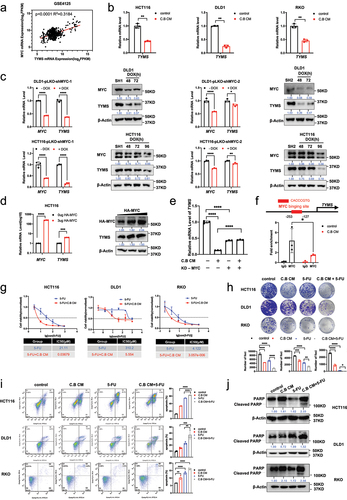
Figure 3. C.B attenuates MYC-mediated expression of TYMS to enhances the chemo sensitivity of CRC to 5-FU.
(a) GSE4125 data base analysis showed that thymidylate synthase (TYMS) is positively correlated with MYC mRNA expression in CRC patients.
(b) qRT-PCR analysis was performed to measure the mRNA levels of TYMS in CRC cells after treatment with 6% C.B CM for 24 h.
(c) qRT-PCR and immunoblot analysis results showed changes of mRNA and protein levels of TYMS in pLKO-Tet-On-shMYC#1 and #2 expressing DLD1 and HCT116 cells after treatment with Doxycycline for several hours (48 and 72 hours for DLD1 cells, 48, 72 and 96 hours for HCT116 cells).
(d) mRNA and protein levels of TYMS in HCT116 cells transfected with the MYC expression plasmid.
(e) qRT-PCR analysis of TYMS in DLD1 cells treated under indicated situations. MYC induced KD with Doxycycline for 72 hours. Cells were treated with 3% C.B CM for 24 h.
(f) DLD1 cells were transfected with MYC expression plasmid, then treated with 6%C.B CM for 24 hours. The binding of MYC on TYMS promoter region were detected by ChIP-PCR in HCT116 cells.
(g) CCK8 assays were performed to detect IC50 of 5-fluorouracil (5-FU) when treated with or without 3%C.B CM in HCT116, DLD1 and RKO cells.
(h) Colony formation assay were performed to show the synergistic effect of 3%C.B CM and 5-FU (3 μM for DLD1 and RKO cells, 2.8 μM for HCT116 cells) in CRC cells. The cells were plated in 12-well plates for 9 days, and the medium was changed every five days.
(i) Flow cytometry analysis of apoptosis in CRC cells treated with 3%C.B CM and 5-FU treatments for 24 h. (DLD1 cell: 200 μM 5-FU, HCT116 cell: 100 μM 5-FU, RKO cells: 150 μM 5-FU).
(j) The protein level of cleaved PARP in 3% C.B CM, 5-FU (250 μM) and 3% C.B CM combination with 5-FU (250 μM) in HCT116, DLD1, RKO cells. Data are presented as mean ± SEM. ns, no significance; *, p < 0.05; **, p < 0.01; ***, p < 0.001; one-way ANOVA test, unpaired two-tailed Student test, and two-way ANOVA test.
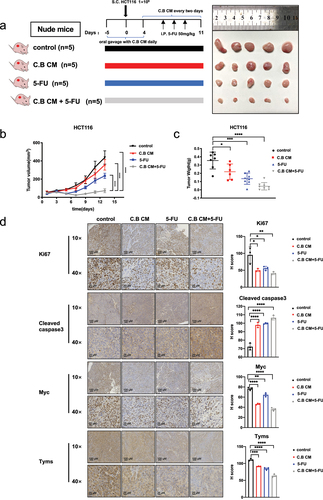
(a) Schematic overview of in vivo experiment and representative images of HCT116 cells xenograft tumor in control (n = 5), C.B CM (n = 5), 5-FU (n = 5), and C.B CM + 5-FU (n = 5) groups.
(b) Tumor volumes of indicated groups.
(c) Tumor weights of indicated groups.
(d) Represent IHC images and quantification analysis of Ki67, CASPASE 3, TYMS and MYC from indicated groups. Staining intensity was quantitated. Scale bar: 10×, 100 μM; 40×, 25 μM. Data are presented as mean ± SEM. ns, no significance; *, p < 0.05; **, p < 0.01; ***, p < 0.001; one-way ANOVA test and two-way ANOVA test.
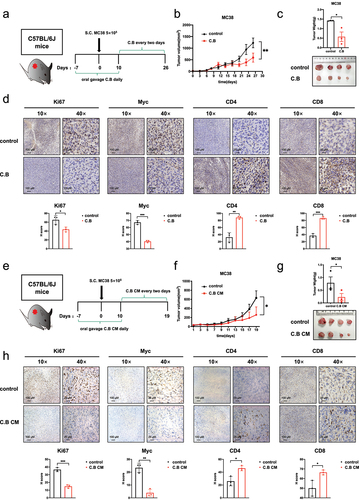
Figure 5. Therapeutic benefits of C.B by downregulating MYC expression and enhancing the immune response through increased CD8+ cell infiltration.
(a) Schematic diagram of the C57BL/6J mice model and C.B treatment schedule.
(b) Tumor growth curves of control (n = 4) and C.B groups (n = 4) were shown. Statistical differences between untreated and the treated animals were analyzed by applying the two-way ANOVA test.
(c) Tumor weights and representative IHC images of tumors in control and C.B groups were shown.
(d) Represent images of Ki67, Myc, CD4 and CD8 immunohistochemistry staining in tumor tissue from control and C.B groups. Staining intensity was quantitated. Scale bar: 10×, 100 μm; 40×, 25 μm.
(e) Schematic diagram of the C57BL/6J mice model and C.B CM treatment schedule.
(f) Tumor growth curves of control (n = 4) and C.B CM groups (n = 4) were shown. Statistical differences between untreated and the treated animal were analyzed by applying the two-way ANOVA test.
(g) Tumor weights and representative images of tumors in control and C.B CM groups were shown.
(e) Represent images of Ki67, Myc, CD4 and CD8 immunohistochemistry staining in tumor tissue from control and C.B CM groups. Staining intensity was quantitated. Scale bar: 10×, 100 μm; 40×, 25 μm. Unpaired two-tailed Student test, two-way ANOVA test.
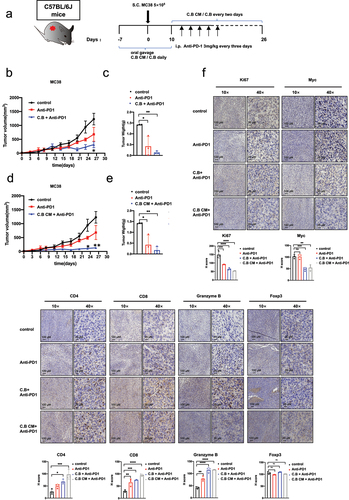
Figure 6. C.B or C.B conditioned medium significantly boost the efficacy of anti-PD1.
(a) Schematic diagram of the C57BL/6J mice model and treatment schedule.
(b) Tumor growth curves of control (n = 4), anti-PD1 (n = 4), and C.B + anti-PD1 groups (n = 4) were shown.
(c) Tumor weights of tumors in control, anti-PD1, and C.B + anti-PD1 groups were shown.
(d) Tumor growth curves of control (n = 4), anti-PD1 (n = 4), and C.B CM + anti-PD1 groups (n = 4) were shown.
(e) Tumor weights of tumors in control, anti-PD1, and C.B CM + anti-PD1 groups were shown.
(f) Represent images of Ki67, Myc, CD4, CD8, Granzyme B, and Foxp3 immunohistochemistry staining in tumor tissue from control and C.B groups. Staining intensity was quantitated. Scale bar: 10×, 100 μm; 40×, 25 μm. Data are presented as mean ± SEM. ns, no significance; *, p < 0.05; **, p < 0.01; ***, p < 0.001; unpaired two-tailed Student test, two-way ANOVA test and one-way ANOVA test.
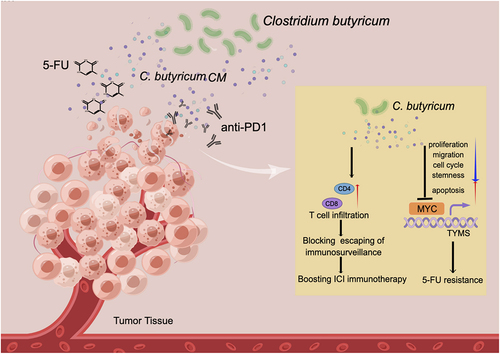
Figure 7. Schematic summary of C.B’s role in modulating 5-FU drug resistance and boosting anti-PD1 immunotherapy.
C.B has a negative impact on MYC stability, thereby reducing TYMS expression and subsequent attenuation of 5-FU resistance. C.B enhances CD4/CD8 T cell infiltration, thereby blocking escaping of immunosurveillance and boosting the efficacy of anti-PD1 (ICI) immunotherapy. The illustration was prepared by Figdraw.
All data supporting the findings of this study are available from the corresponding author upon request. RNA-Seq data for this article can be accessed online at https://www.ncbi.nlm.nih.gov/sra/PRJNA880980.