Figures & data
Figure 1. Experimental design of the study (N = 24) and intestinal sites studied. Abbreviations: HFD – high-fat diet; CD – control diet; M – male; F – female; Met+ – receiving metformin treatment for 10 weeks; Met- – not receiving metformin treatment.
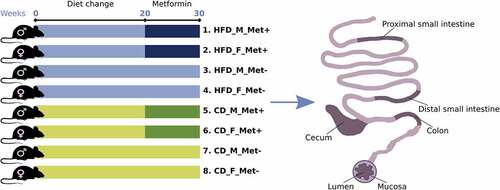
Figure 2. Microbiome composition at different sites of high-fat diet-fed mice at the genus level – top 20 genera are shown. Mucosal layer: (a) proximal small intestine; (b) distal small intestine; (c) cecum; (d) colon. Luminal content layer: (e) proximal small intestine; (f) distal small intestine; (g) cecum; (h) colon. Samples representing mice receiving metformin treatment are highlighted. Red and blue bars under each plot indicate females and males, respectively.
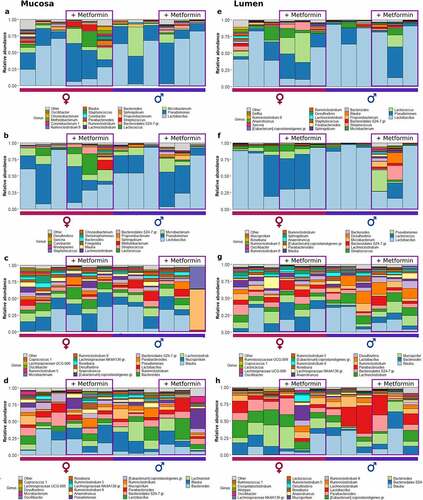
Figure 3. Microbiome composition at different sites of control diet-fed mice at the genus level – top 20 genera are shown. Mucosal layer: (a) proximal small intestine; (b) distal small intestine; (c) cecum; (d) colon. Luminal content layer: (e) proximal small intestine; (f) distal small intestine; (g) cecum; (h) colon. Samples representing mice receiving metformin treatment are highlighted. Red and blue bars under each plot indicate females and males, respectively.
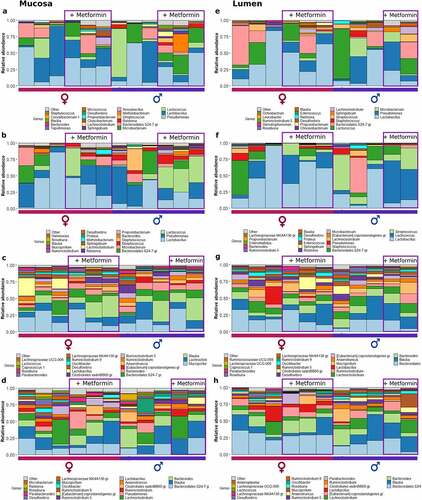
Figure 4. Microbiome alpha diversity analysis expressed as Shannon index: (a) between intestinal parts; (b) between intestinal layers. Microbiome alpha diversity analysis in response to metformin treatment expressed as Shannon index, n = 12 per group: (c) between intestinal parts; (d) between intestinal layers. PSI – proximal small intestine; DSI – distal small intestine; CEC – cecum; COL – colon; M – mucosa; L – lumen. **adjusted p < 0.05; *** adjusted p < 0.01.
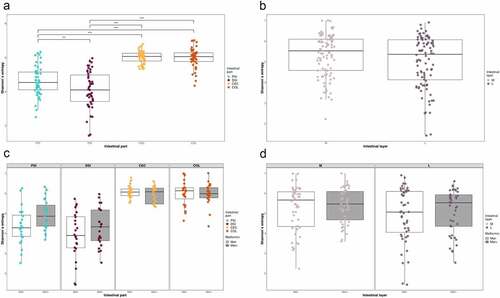
Figure 5. Beta diversity of all samples taken together was estimated using principal components analysis on centered log-ratio transformed values. Intestinal part, diet, and metformin treatment status are indicated. PSI – proximal small intestine; DSI – distal small intestine; CEC – cecum; COL – colon. In the corresponding intestinal part, continuous and dashed ellipses represent Met+ and Met- subsets, respectively.
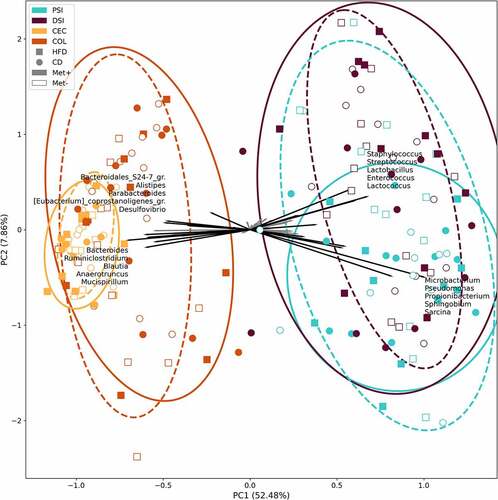
Figure 6. Beta diversity in each of the groups in response to 10 weeks long metformin treatment in each of the intestinal sites, n = 6 per group: (a) mucosa; (b) lumen; (c) proximal small intestine; (d) distal small intestine; (e) cecum; (f) colon.
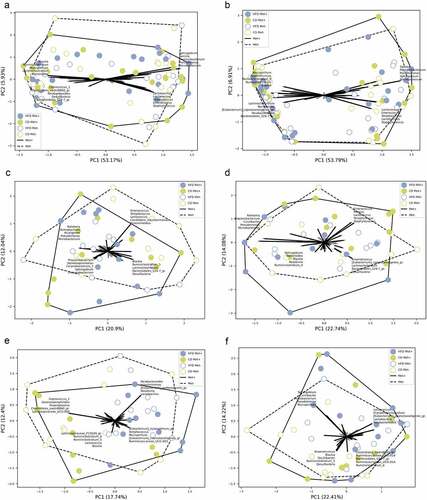
Figure 7. Differentially abundant genera in response to metformin treatment in different intestinal parts and layers (expressed as LogFC), n = 12 per group: (a) mucosa; (b) lumen; (c) proximal small intestine; (d) distal small intestine; (e) cecum; (f) colon. Blue bars represent genera with increased abundance among metformin users, and red bars – with decreased abundance. Dots of the corresponding color indicate all the individual features assigned to the genus.
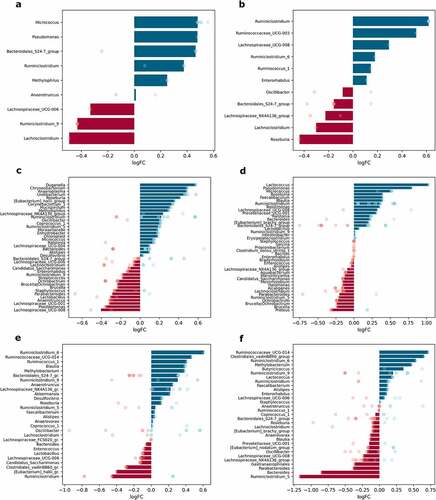
Figure 8. Differentially abundant genera between sexes in different intestinal parts and layers (expressed as LogFC), n = 12 per group: (a) mucosa; (b) lumen; (c) proximal small intestine; (d) distal small intestine; (e) cecum; (f) colon. Blue bars represent genera with increased abundance among males, and red bars – with decreased abundance. Dots of the corresponding color indicate all the individual features assigned to the genus.
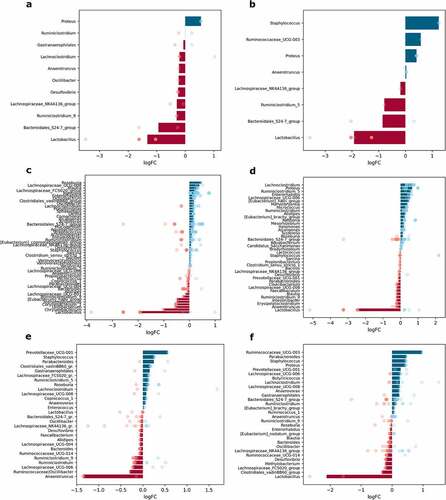
Figure 9. Differentially abundant genera between high-fat diet-fed and control diet-fed mice in different intestinal parts and layers (expressed as LogFC), n = 12 per group: (a) mucosa; (b) lumen; (c) proximal small intestine; (d) distal small intestine; (e) cecum; (f) colon. Blue bars represent genera with increased abundance among HFD-fed mice, and red bars – with decreased abundance. Dots of the corresponding color indicate all the individual features assigned to the genus.
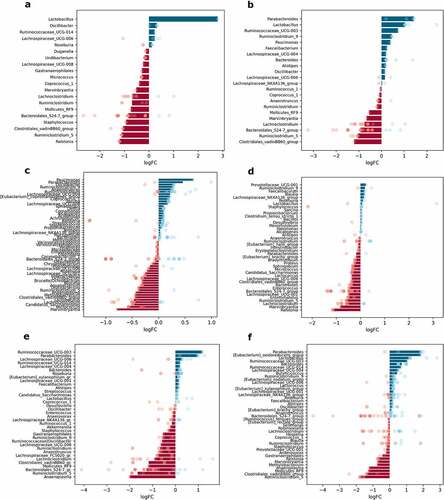
Figure 10. Differentially abundant genera between lumen and mucosa in different intestinal parts (expressed as LogFC), n = 12 per group: (a) proximal small intestine; (b) distal small intestine; (c) cecum; (d) colon. Blue bars represent genera with increased abundance in the lumen, and red bars – with decreased abundance. Dots of the corresponding color indicate all the individual features assigned to the genus.
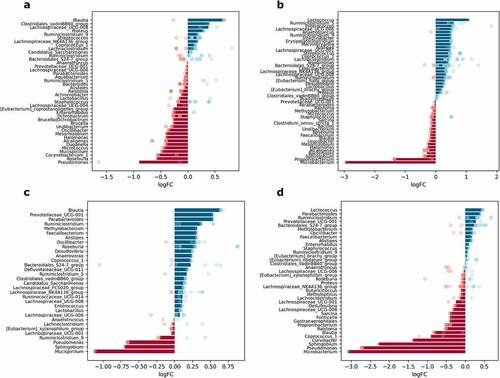
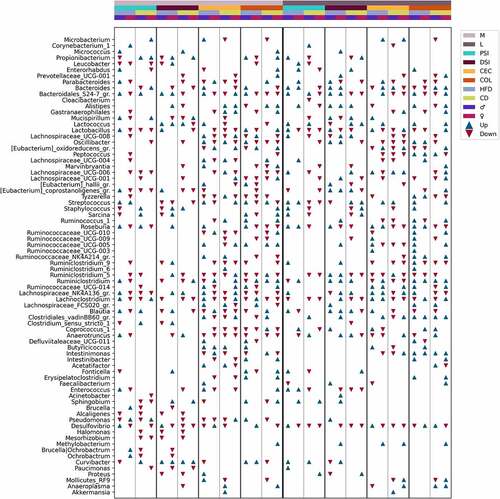
Figure 11. Summary of differentially abundant genera between Met+ and Met- mice in different subsets formed by various combinations of the levels of studied factors (expressed as LogFC), n = 3 per group. Only the genera with an absolute LogFC≥1 in at least one of the subsets are included, indicating the directions of changes (with an absolute LogFC>0.2), if detected, in all subsets. M – mucosa; L – lumen; PSI – proximal small intestine; DSI – distal small intestine; CEC – cecum; COL – colon. Blue triangle – an increase of the abundance among metformin users; red triangle – a decrease among metformin users.