
Figures & data
Figure 1. Shorter sleep time is associated with lower HD5 concentration.
(a) General information and distribution of sleep time in participants of this study. (b) Correlation analysis between sleep time and fecal HD5 concentration in all participants. Statistical significance was evaluated by Pearson’s correlation coefficient test. Values in parentheses and dashed lines in the plot represent the range of 95% confidence interval.
Figure 2. Sleep time is associated with occupancy of several genera in the intestinal microbiota .
(a) Intestinal microbiota composition of each participant at the genus level. Participants were sorted by relative abundance of Lachnospiraceae; unassigned in descending order. Genera which average of relative abundance in all participants was below 0.5% were integrated as “Other genera”. (b) Correlation analysis between sleep time and centered log ratio (CLR)-transformed abundance of each genus. Statistical significance was evaluated by Pearson’s correlation coefficient test. Values in parentheses and dashed lines in the plots represent the range of 95% confidence interval.
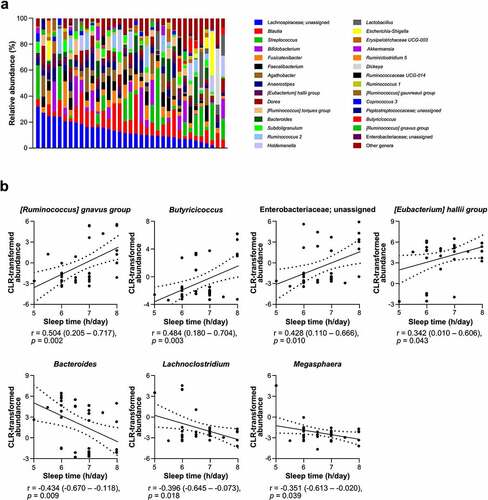
Figure 3. Shorter sleep time is associated with lower fecal SCFA concentration.
Correlation analysis between sleep time and fecal concentration of total and each SCFA. Statistical significance was evaluated by Pearson’s correlation coefficient test. Values in parentheses and dashed lines in the plots represent the range of 95% confidence interval.
Table 1. Correlation analysis among fecal HD5 concentration, CLR-transformed abundance of sleep-related genera, and fecal SCFA concentration.
Data availability statement
The data that support the findings of this study are available on request from the corresponding author, Kiminori N. The data are not publicly available due to their containing information that could compromise the privacy of research participants.