
Figures & data
Figure 1. Gpr120−/− mice demonstrate altered gut microbiota composition.
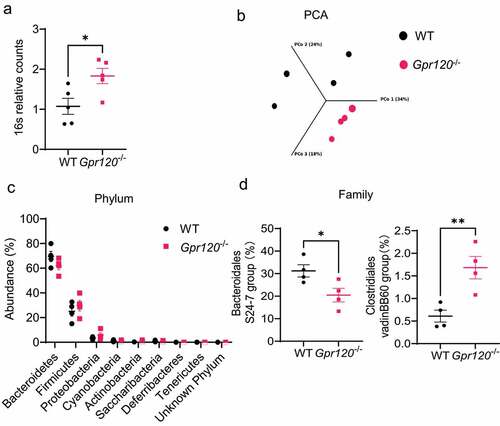
Figure 2. Gpr120−/− mice are impaired in the clearance of intestinal Citrobacter rodentium and are susceptible to intestinal inflammation.
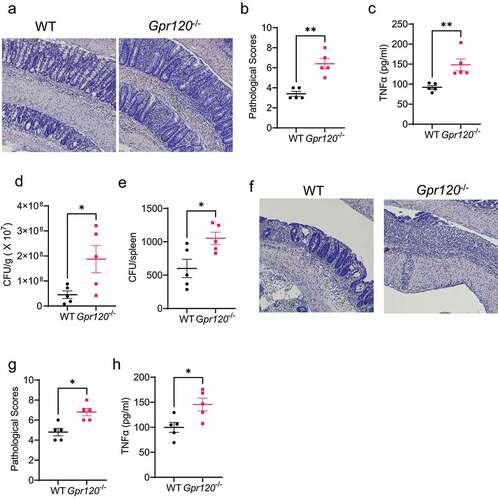
Figure 3. Depletion of neutrophils decreases the intestinal clearance of Citrobacter rodentium.
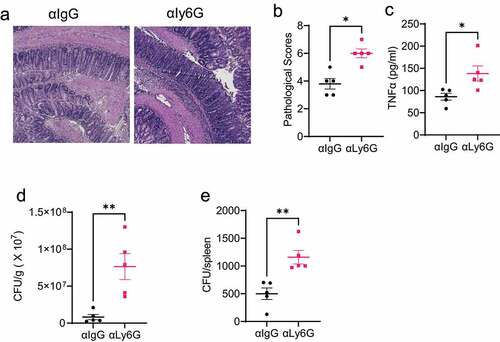
Figure 4. GPR120 agonist promotes neutrophil inhibition of enteric bacterial growth through the upregulation of ROS and NETs.
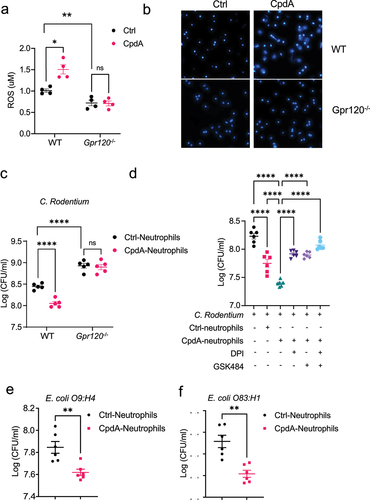
Figure 5. mTOR mediates GPR120 induction of neutrophil production of ROS and formation of NETs.
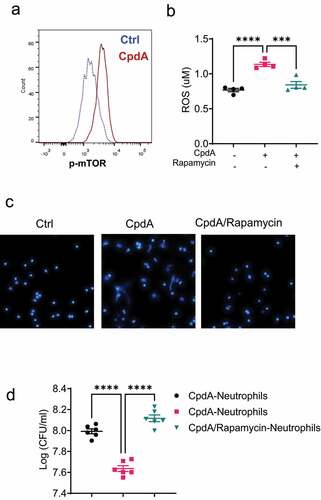
Figure 6. GPR120 regulates NETs formation in neutrophils through the upregulation of glycolysis.
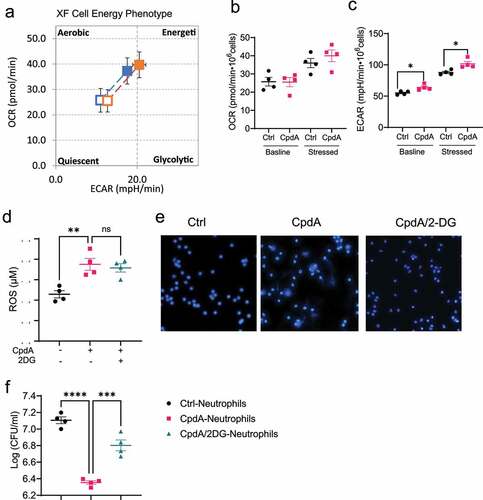
Figure 7. GPR120 regulates IL-17A and IL-22 production and IEC barrier function in neutrophils.
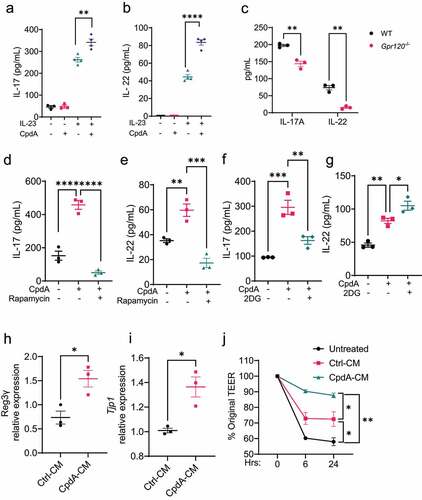
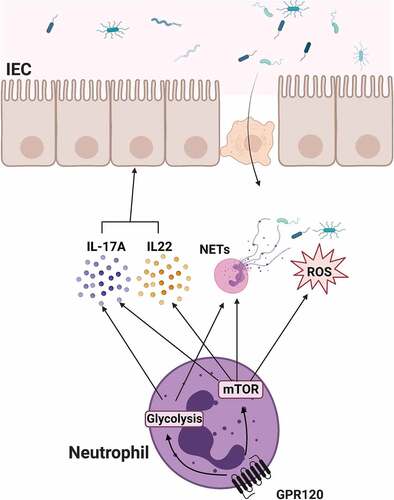
Figure 8. The schematic diagram of GPR120 regulation of neutrophil anti-bacterial function.
Supplemental Material
Download PDF (528.7 KB)Data availability statement
16S rRNA sequencing data have been deposited in SRA under the BioProject number PRJNA716350 (https://www.ncbi.nlm.nih.gov/bioproject/PRJNA716350).