
Figures & data
Figure 1. Increased disease severity in mice with DSS challenged with C. difficile. (a) Schematic outlining the timing and treatment regiments for each group (n = 5–10/group). Mice were culled and samples for further analysis were collected at 2 days post-infection. (b, c) Weight loss (b) and disease activity scores (c) in each group are shown, and significant differences between the DSS and DSSCD groups are indicated on the corresponding day (*P < 0.05, **P < 0.01). (d) Representative images of H&E and alcian blue staining of colonic tissue (left) and histological scores (right). Scale bar, 200 μm. (e – h) Relative expression levels of the gut barrier proteins MUC2 and CLDN2 (e) and the cytokines MCP1, IL-6, and IL-1β (g) were examined by real-time qPCR using actin as an internal control. Protein concentrations of MCP-1, IL-6, and IL-1β in the colon (f) and serum (h) were detected using flow cytometry. Colonic cytokine production (f) was normalized to the total protein concentration. (i and j) the C. difficile burden in the colonic contents of mice in different groups at different time points post-infection was measured by CFU counting through culturing (i) and real-time qPCR analysis of tcdB relative expression (j). Each dot indicates an individual mouse. Data are shown as the mean ± standard deviation (SD) and represent at least three independent experiments. Statistical analysis between the groups was performed by the Mann – Whitney test. *P < 0.05, **P < 0.01; NS, not significant.
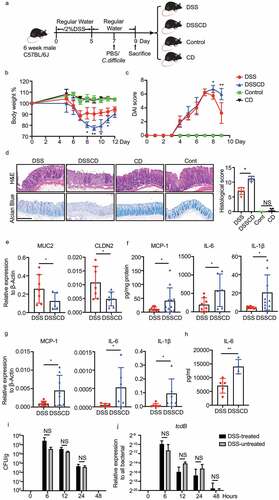
Figure 2. The gut microbiota is altered in mice with colitis challenged with C. difficile. (a – d) the effect of C. difficile on mice with colitis was independent of toxin production, as indicated by weight loss (a), H&E staining (b), histological scores (c), and production of IL-6 as shown by ELISA (d). Scale bar, 200 μm. (e and f) PcoA at the OTU level for samples from feces (e) and colonic contents (f), and the plots were based on the Bray – Curtis distance. The horizontal and vertical axes represent inter-sample variations. Each point represents an individual sample, and different colors refer to different groups. (g) Cladograms were generated by linear discriminant analysis effect size analysis to detect the differences in bacterial taxa between the DSSCD and DSS groups. Circles show phylogenetic levels from the phylum to the genus. To screen out differentially abundant taxa, the linear discriminant analysis threshold score was set to>4.0. Red and blue bars indicate taxa enrichment in the DPI48H_DSS and DPI48H_DSSCD groups, respectively. (h) Correlations between IL-6 levels and relative abundance of g_prevotellaceae_ucg001 (OTU288) in DSSCD groups (DPI6H_DSSCD and DPI48_DSSCD) were analyzed by Spearman’s correlation. Each dot represents a value from an individual mouse. Data are expressed as the mean±sd. Statistical differences between groups were assessed by the Mann – Whitney test. *P < 0.05.
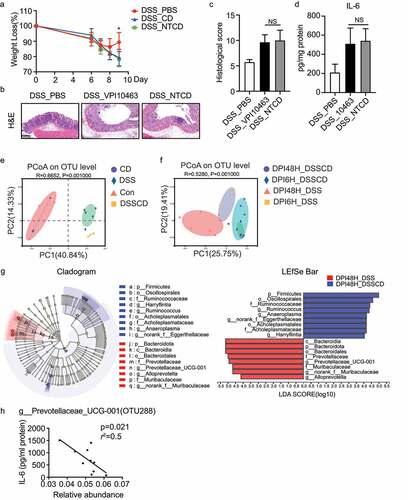
Figure 3. Altered gut microbiota in DSSCD group contributes to the severity of colitis. (a) Experimental design of FMT. The mice were pretreated with an antibiotic cocktail for 3 weeks, followed by 2% DSS treatment and oral gavage of fecal samples derived from DSSCD and DSS group every other day during modeling. (b – e) the severity of colitis in the mouse transplanted fecal microbiota in the DSSCD and DSS groups was assessed by body weight loss (b), H&E and alcian blue staining (c), histological scores (d), and IL-6 levels from colonic tissue (e). Scale bars, 200 μm. (f) the relative abundance of OTU288 and OTU287 was quantified by real-time qPCR with normalization to total bacterial (16S rRNA). (g – h) the effect of C. difficile on mice with colitis and antibiotic pretreatment was evaluated by weight loss (g), histological scores from H&E staining (h), and colonic IL-6 production by ELISA (i). Scale bars, 200 μm. Data are shown as the mean±sd and represent at least three independent experiments. Statistical analysis between groups was conducted by the Mann – Whitney test. *P < 0.05, **P < 0.01.
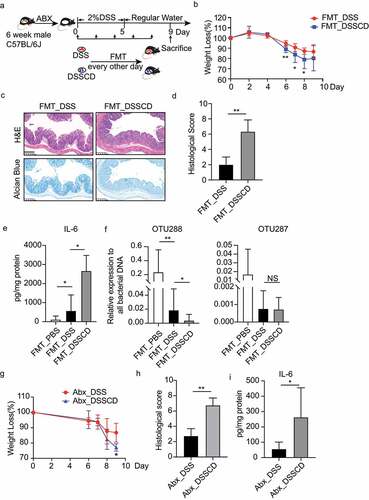
Figure 4. Mice with colitis challenged with C. difficile show increased neutrophil infiltration and enhanced expression of migratory genes. (a) Representative flow plots (left) and relative quantification (right) of the proportions of CD11b+Ly6G+ in CD45 cells. (b) Representative images of immunohistochemical MPO staining. Scale bars, 200 μm. (c) Upregulated genes in the DSSCD group relative to the DSS group were enriched for GO functional analysis. The top 10 pathways are shown in a bubble plot. The size and color of the bubble represent gene numbers enriched in each pathway and the respective enrichment significance. (d) a heatmap depicts upregulated gene expression from the most enriched pathways between the DSSCD and DSS groups. (e) a gene expression interaction network was generated by STRING and shown by Cytoscape. Red and blue rectangles represent up- and downregulated genes in the DSSCD group, respectively. The size of the rectangles indicates their betweenness centrality value. (f) Neutrophils were isolated from bone marrow in the DSSCD and DSS groups. The number of migrated neutrophils in the lower chamber was counted using trypan blue staining. (g) the mRNA transcripts of IL-6, IL-1β, CXCL2, and CCL4 in neutrophils isolated from the DSSCD and DSS groups were detected by real-time qPCR. Gene expression was normalized to β-actin. Data are shown as the mean±sd. Each dot indicates an individual mouse. Data (a, b, f, and g) are representative of at least three independent experiments. Statistical analysis between the groups was performed by the Mann – Whitney test. *P < 0.05, **P < 0.01, ***P < 0.001.
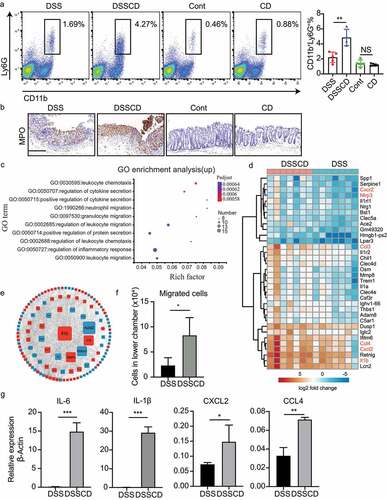
Figure 5. Gut microbiota in DSSCD mice induces neutrophils and THP-1 cells, leading to higher levels of proinflammatory cytokines and chemokines. Neutrophils (a) and THP-1 cells pretreated with PMA (b) were stimulated in vitro in the presence or absence of microbiota suspensions prepared from different groups for 3 hours. The mRNA levels of IL-6, IL-1β, MCP-1 CXCL2, and CCL4 were measured by real-time qPCR and normalized to β-actin. Statistical analysis was performed by the Mann – Whitney test. *P < 0.05, **P < 0.01, ***P < 0.001. Results are representative of at least three independent experiments.
Figure 6. Inhibition of neutrophil migration by SB225002 alleviates colitis driven by C. difficile. (a) Schematic diagram of the CXCR2 inhibition model. After DSS mice were challenged with or without C. difficile on day 7, the mice were injected i.P. with the CXCR2 inhibitor SB225002 at a dose of 1 mg/kg/mouse on days 7 and 8, and PBS was used as a negative control. (b – d) the severity of colitis was assessed by weight loss (b), H&E and MPO staining of colonic sections (c), and histological scores (d). Scale bars, 200 μm. (e and f) Representative flow cytometric plots (e) and a histogram (f) quantifying the proportions of CD11b+Ly6G+ in CD45+ cells. (g and h) Expression of IL-6, IL-1β, and CXCL2 mRNA was detected by real-time qPCR in isolated neutrophils (g) and colonic tissue (h) with or without inhibitor treatment. (i) Colonic contents were collected to detect the relative abundance of OTU288 and OTU287 as shown by real-time qPCR. DNA expression was normalized to total bacteria (16S rRNA). Significant differences were determined by the Mann – Whitney test. *P < 0.05, **P < 0.01, ***P < 0.001. Data are shown as the mean±sd and are representative of at least three independent experiments. i.P., intraperitoneally; DPI, days post-infection; NS, no significance.
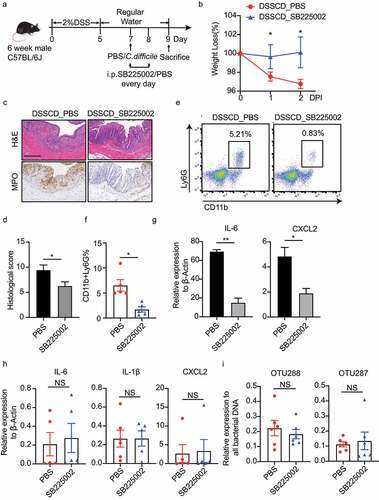
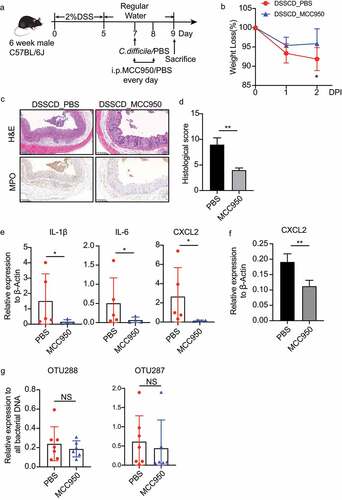
Figure 7. Inhibition of IL-1β by MCC950 ameliorates the severity of colitis challenged with C. difficile. (a) Schematic diagram of the MCC950 inhibition model. After DSS mice were challenged with C. difficile on day 7, they were injected i.P. with MCC950 at a dose of 20 mg/kg/mouse on days 7 and 8, and PBS was used as a negative control. (b – d) Disease severity was assessed by weight loss (b), H&E staining (c), and histological sores (d). (e and f) Expression of IL-1β, IL-6, and CXCL2 mRNA in colonic tissue (e) and CXCL2 mRNA in isolated neutrophils (f) were detected by real-time qPCR and normalized to β-actin. (g) the relative DNA burden of OTU288 and OTU297 was measured by real-time qPCR and normalized to total bacteria (16s rRNA). Significant differences were determined by the Mann – Whitney test. *P < 0.05, **P < 0.01, ***P < 0.001. Data are shown as the mean±sd and are representative of at least three independent experiments. i.P., intraperitoneally; DPI, days post-infection; NS, no significance.
Supplemental Material
Download Zip (1.2 MB)Data availability statement
The sequence dataset generated from this study has been deposited in the NCBI database under BioProject number PRJNA897872 in https://www.ncbi.nlm.nih.gov/bioproject/. The data that support the findings of this study are available from the corresponding author upon reasonable request.