
Figures & data
Table 1. List of qRT-PCR primers used for this paper.
Table 2. List of flow cytometry antibodies used for this paper.
Figure 1. Epithelial-specific deficiency of talin-1 enhances susceptibility to C. rodentium-induced death and weight loss. (a-c) Colonic epithelial cells were isolated from Tln1fl/fl and Tln1Δepi mice. (a) Tln1 mRNA expression was determined by RT-qPCR; n = 3–4 per genotype. (b) Representative Western blot of talin-1 protein (270 kDa) expression. (c) Densitometry analysis of talin-1 protein expression; n = 3 mice per group. (d-f) Tln1fl/fl and Tln1Δepi mice were infected with 5 × 10Citation8 CFU of C. rodentium by oral gavage and monitored daily for 14 days; n = 8–9 uninfected mice and n = 12–15 infected mice per genotype. Data pooled from 2 independent experiments. (d) Kaplan-Meier curves of uninfected and infected mice. (e) Daily body weights depicted as percent of initial body weight. (f) Tln1 mRNA expression in whole colon tissues determined by RT-qPCR; n = 4 uninfected mice and n = 6–8 infected mice per genotype. (g) Western blot of talin-1 protein (270 kDa) and (h) densitometry analysis; n = 3 mice per group. All values are reported as mean ± SEM. Statistical analyses, where shown; *P < 0.05, **P < 0.01, ***P < 0.001, and ****P < 0.0001 determined by (a and c) Student’s t test, (d) Log-rank (Mantel-Cox) test, (e) 2-way ANOVA and Tukey test, §P < 0.05 and §§P < 0.01 compared to infected Tln1fl/fl littermate controls, (f and h) 1-way ANOVA and šídák’s test compared to Tln1fl/fl.
Figure 2. Epithelial-specific talin-1 contributes to pathogen containment by facilitating actin rearrangement and attachment ofC. rodentium to the epithelium. (a-b) Bacterial burden was assessed by culturing serial dilutions of homogenized tissues and normalizing to tissue weight on day 14 post-infection (p.I.). (a) C. rodentium colonization of the colon; n = 15 infected Tln1fl/fl mice and n = 12 infected Tln1Δepi mice. Data pooled from 2 independent experiments. *P < 0.05 determined by Student’s t test. (b) C. rodentium colonization of the spleen;n = 5 uninfected mice per genotype, n = 15 infected Tln1fl/fl mice, and n = 10 infected Tln1Δepi mice. (c) Representative immunofluorescence images of C. rodentium (green) and DAPI (blue) in colon tissues of uninfected and infected mice; n = 4 mice per group. (d) Representative images of FAS (white) co-stained with C. rodentium (green) in colon tissues of uninfected and infected mice; n = 4 mice per group. All values are reported as mean ± SEM. Statistical analyses, where shown; *P < 0.05 determined by Student’s t test. (c-d) Scale bars represent 100 μm.
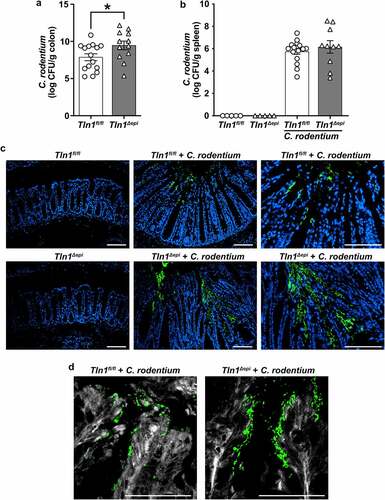
Figure 3. Talin-1 moderates C. rodentium-induced acute inflammation. Tln1fl/fl and Tln1Δepi mice were infected with 5 × 10Citation8 CFU of C. rodentium by oral gavage for 14 days. Data pooled from 2 independent experiments. (a) Representative H&E images of the Swiss-rolled colon tissues from uninfected and infected mice. (b) Histologic injury scores derived from the H&E-stained tissues; n = 8–9 uninfected mice and n = 12–15 infected mice per genotype. (c) Epithelial damage scores and total inflammation scores that were used to generate the histologic injury score in b. (d) Colon weight as a proportion of body weight on day 14 post-inoculation. Each symbol is a different mouse. All values are reported as mean ± SEM. Statistical analyses, where shown; *P < 0.05, **P < 0.01, and ****P < 0.0001 determine by (b and d) 1-way ANOVA with Tukey test; (c) Student’s t test. (a) Scale bars represent 200 μm.
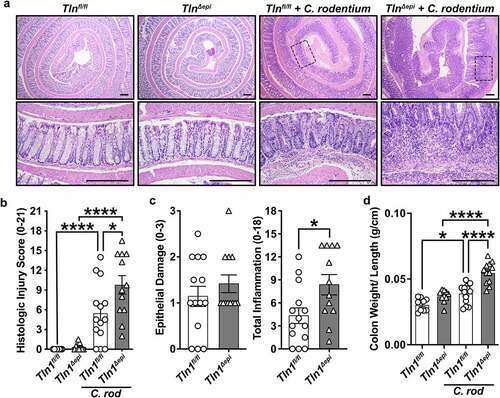
Figure 4. Effect of epithelial talin-1 loss on the fecal microbiome. 16S sequencing was performed on DNA extracted from colonic feces of naïve Tln1fl/fl and Tln1Δepi mice; n = 5 mice per genotype. Alpha diversity evaluated by (a) Shannon Index and (b) Chao1 Index. The relative abundance of each (c) phylum and (d) genus in the gut colonic bacterial community; *P < 0.05.
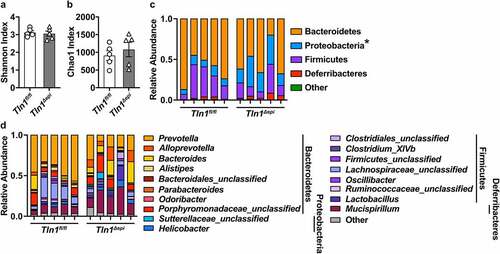
Figure 5. Knockdown of talin-1 in epithelial cells heightens neutrophil recruitment but diminishes the T cell response to pathogenic bacteria. (a) Representative images of colon tissues immunoperoxidase-stained for MPO and (b) the quantification of MPO+ cells per high-powered field (H.P.F). n = 4 uninfected mice and n = 5 infected mice per genotype. Each symbol is a different mouse. Gating strategy (c) and quantification (d) of myeloid cells isolated from the colonic lamina propria and assessed by flow cytometry; n = 4–5 uninfected mice and n = 4 infected mice per genotype. Plots were pre-gated for single, live CD45+CD11b+ cells. Neutrophils were identified as CD45+CD11b+Ly6G+CD11c – and dendritic cells as CD45+CD11b+Ly6G – CD11c+. Proinflammatory macrophages were identified as CD45+CD11b+Ly6G – CD11c – Ly6C+MHCII+ and antiinflammatory macrophages as CD45+CD11b+Ly6G – CD11c – Ly6C – MHCII+. All values are reported as mean ± SEM. Statistical analyses, where shown; *P < 0.05, **P < 0.01, and ****P < 0.0001 determined by (b) 1-way ANOVA and Tukey test; (d) 1-way ANOVA and šídák’s test. Scale bars represent 100 μm.
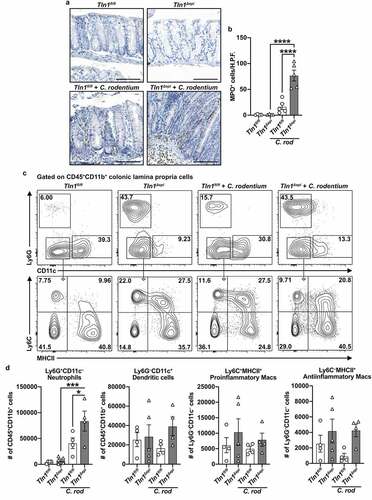
Figure 6. Knockdown of talin-1 in epithelial cells reduces T cell infiltration and activation in the colonic mucosa. (a) Representative images of colon tissues immunoperoxidase-stained for CD3 and (b) the quantification of CD3+ cells per mmCitation2. n = 4 uninfected mice and n = 5 infected mice per genotype. (c) mRNA expression of T cell chemokines analyzed by RT-qPCR. (d) mRNA expression of markers of T cell activation analyzed by RT-qPCR. (c and d) n = 4 uninfected mice and n = 8 infected mice per genotype. (e and f) Lymphocytes were isolated from the lamina propria of uninfected and infected mice. Following isolation, cells were stimulated with PMA/Ionomycin and GolgiStop, and intracellular cytokine expression was analyzed by flow cytometry. Plots were pre-gated for single, live CD3+CD4+ cells. All values are reported as mean ± SEM. Statistical analyses, where shown; **P < 0.01 and ****P < 0.0001 determined by (b) 1-way ANOVA and Tukey test; (c-d) 1-way ANOVA with Kruskal-Wallis test, followed by a Mann-Whitney U test; (f) 1-way ANOVA and šídák’s test. Scale bars represent 100 μm.
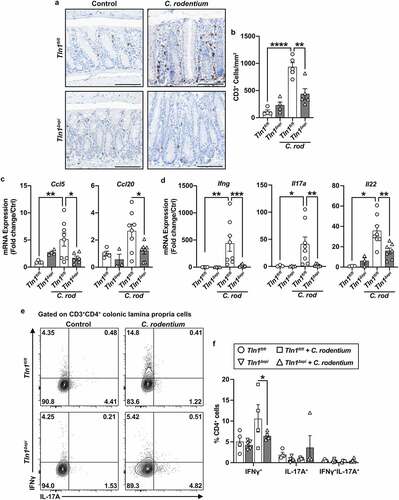
Figure 7. Loss of epithelial-specific talin-1 enhances pathogen-induced colonic hyperplasia. (a) Representative images of colon tissues immunoperoxidase-stained for Ki-67. n = 4 uninfected mice and n = 4–5 infected mice per genotype. (b) Colonic crypt length. Each dot represents an individual crypt that was visible from base to opening; n = 70–107 crypts counted from 4 different mice per group. (c) the proportion of the individual crypts that contained Ki-67+ nuclei determined by measuring from the base of the crypt to the last positive nuclei. All values reported with the median depicted as a thick line and the upper and lower quartiles as thin lines. Statistical analyses, where shown; **P < 0.01 and ****P < 0.0001 determined by 1-way ANOVA and Kruskal-Wallis test. Thick scale bars represent 1000 μm and thin scale bars represent 100 μm.
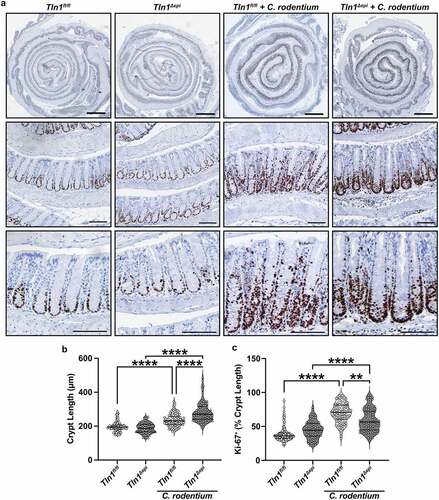
Figure 8. Loss of epithelial-specific talin-1 suppresses pathogen-induced epithelial apoptosis. (a) Representative images of colon tissues immunoperoxidase-stained for cleaved caspase-3. (b) the proportion of cleaved caspase-3-positive mucosa determined by measuring the total height of the mucosa and the height of the region with positive staining. Each dot represents measurements from a high-powered field; n = 12–15 fields from 3 different mice per group. All values reported with the median depicted as a thick line and the upper and lower quartiles as thin lines. (c) Expression of the gene encoding TNF-α analyzed by RT-qPCR. n = 4 uninfected mice and n = 6–7 infected mice per genotype. Each symbol is a different mouse. Values are reported as mean ± SEM. *P < 0.05 and **P < 0.01 determined by (b) 1-way ANOVA and Tukey test and (c) 1-way ANOVA with Kruskal-Wallis test, followed by a Mann-Whitney U test. Scale bars represent 100 μm.
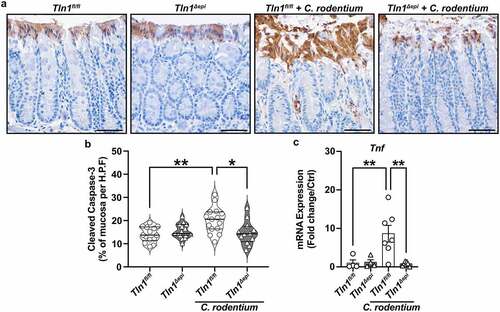
Figure 9. Epithelial talin-1 deficiency inhibits epithelial cell mobility in vitro. Representative images of colon organoids (colonoids) generated from crypts isolated from Tln1fl/fl and Tln1Δepi mice and imaged daily for 8 days; n = 3 mice per genotype. Arrowheads highlight colonoids with budding. White scale bars represent 2000 μm and black scale bars represent 100 μm.
Data availability statement
The authors confirm that the data supporting the findings of this study are available within the article. The 16S rRNA sequencing of the fecal microbiota has been deposited on the Sequence Read Archive website with the BioProject ID: PRJNA946899 at this URL: https://www.ncbi.nlm.nih.gov/bioproject/PRJNA946899.