
Figures & data
Figure 1. CDDP induced senescence and a robust SASP in p53 wild-type ESCC cells and in human ESCC cancerous tissues.
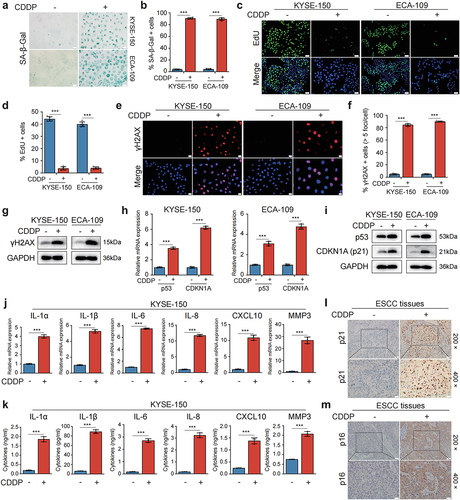
Table 1. The expression of p21 and p16 in cancerous tissues of ESCC patients treated with or without CDDP-based neoadjuvant chemotherapy.
Figure 2. CDDP-induced SASP promoted tumorigenesis in the xenograft model and ESCC cell growth, migration, invasion, and chemoresistance.
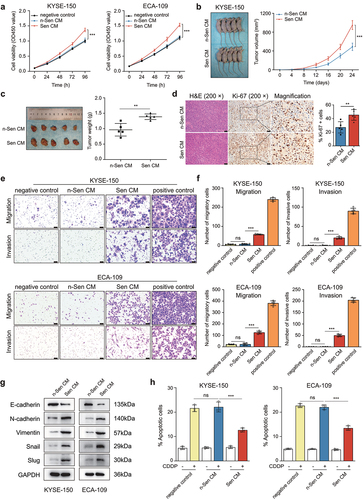
Figure 3. Gut microbiota composition was altered in ESCC tissues and F. nucleatum was correlated with poor prognosis and chemoresistance in ESCC patients.
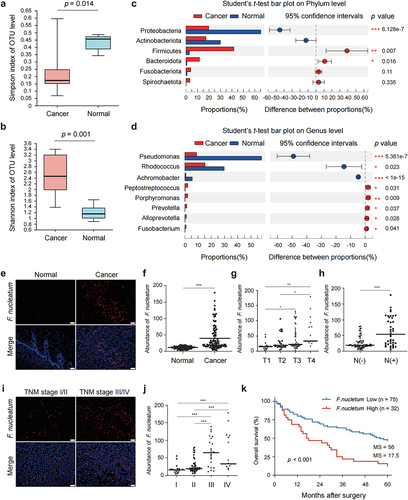
Table 2. Clinicopathological features in F. nucleatum-low vs. F. nucleatum-high ESCC patients.
Figure 4. F. nucleatum stimulation aggravated the SASP-mediated malignant phenotypes and chemoresistance of ESCC cells.
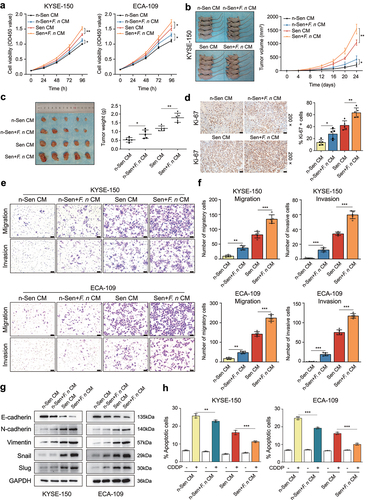
Figure 5. F. nucleatum infection enhanced the secretion of CDDP-induced SASP through the activation of DNA damage response pathway.
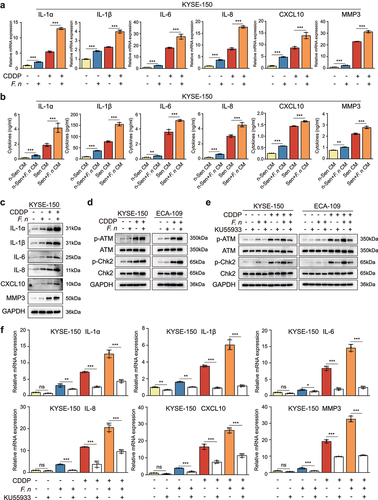
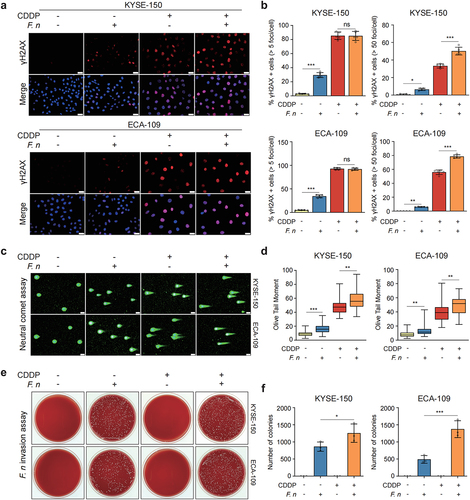
Figure 6. F. nucleatum invaded and survived in ESCC cells and increased DNA damage.
Supplemental Material
Download Zip (6.9 MB)Data availability statement
All sequencing data associated with this study have been uploaded to the NCBI (Sequence Read Archive) SRA database under the accession number PRJNA866879 (http://www.ncbi.nlm.nih.gov/bioproject/866879).