
Figures & data
Figure 1. Structural metagenomics pipeline used to identify gut bacterial AzoR Enzymes. (a) Conserved residues (blue) used to define two-step rubric to identify AzoR proteins shown in EcAzoR (PDB: 2D5I), showing placement of FMN (yellow) and methyl red (red) docked as an example ligand. (b) Workflow of structure-guided rubric used to identify AzoR proteins across the IGC and IBDMDB. (c) Phylogenetic distribution of unique putative AzoR proteins across IGC and IBDMDB. (d) Occurrence for each AzoR sequence per Individual across IGC arranged by phyla, ****P < 0.0001 by a one sample t test comparing Firmicutes to all other groups.
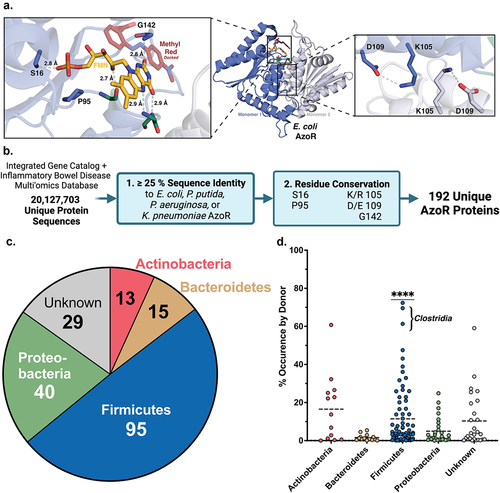
Figure 2. Diversity across atlas of bacterial AzoRs and activity of purified proteins. (a) Sequence Similarity Network of AzoR proteins across IGC and IBDMDB including reference sequences used to identify putative AzoRs colored according to Phyla, with abbreviations shown for proteins used in this study (E=1×10−40). (b) Catalytic efficiencies for Methyl Red azo reduction by purified AzoR enzymes as a function of hydride donor present in reaction. (c) Catalytic efficiencies for Amaranth azo reduction by purified AzoR enzymes. Statistical comparisons reflect activity of CmAzoR compared to other enzymes and were calculated using Tukey’s multiple comparisons test. *P < 0.05, ****P < 0.0001.
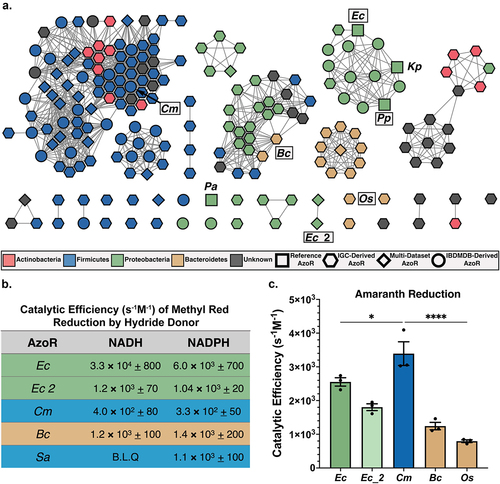
Figure 3. AzoR active site environments point to substrate specificity. (a) Homodimers of crystal structures of EcAzoR (green) and CmAzoR (blue) overlaid and analysis of active site structural disparities. FMN (yellow) is located according to the structure of EcAzoR (PDB: 2D5I). Amaranth (red) was modeled into the active site using methyl red in the crystal structure of PaAzoR (PDB: 2V9C) as a reference for ligand placement. (b) Active site docked models for Amaranth (B) and Sulfasalazine (d) azo reduction by purified AzoR enzymes. Ligands were docked into active sites of crystal structures to point toward structural differences driving differential enzyme activity. Error bars represent SEM across three biological replicates. Catalytic efficiencies and active site docked models for Sulfasalazine (c) azo reduction by purified AzoR enzymes. Statistical comparisons reflect activity of CmAzoR compared to other enzymes and were calculated using Tukey’s multiple comparisons test, **P < 0.01.
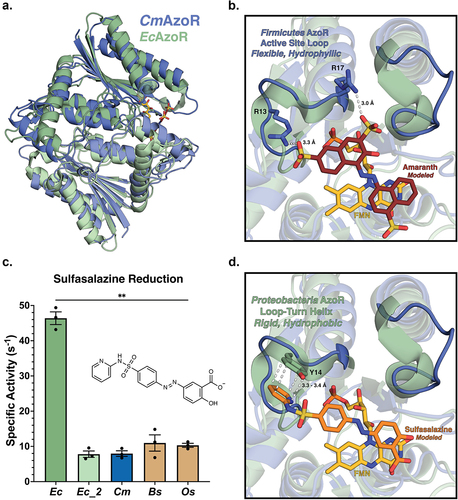
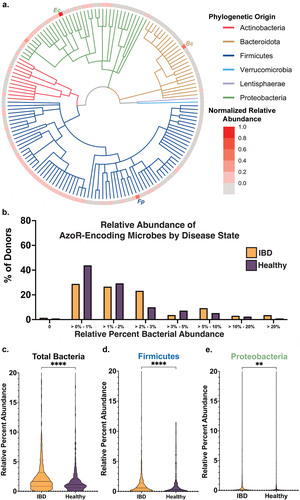
Figure 4. Azo—encoding microbes are sparse in health and disease. (a) Cladogram reflecting microbes used for integrative analysis query, with abundances for each relative to other AzoR-encoding strains. Percent of percent of donors containing AzoR-encoding microbes as determined by Integrated Search space combining EC Annotations, extant AzoR-encoding microbes reported in literature, and species identified using structural metagenomics in this study for total bacterial abundance. (b) Abundance of Percent of percent of donors containing AzoR-producing microbes at a range of relative abundance levels across the x-axis, queried using an Integrated Search space combining EC Annotations, extant AzoR-producing microbes reported in literature, and species identified using structural metagenomics in this study for total bacterial abundance. Violin plots comparing AzoR abundances between IBD patients and healthy individuals across the IBDMDB, comparing relative % abundances for all microbes (c), Firmicutes (d), and Proteobacteria (e) that produce AzoR genes as annotated by Integrative Analysis used in this manuscript. ****P < 0.0001, **P < 0.01 by an unpaired t test.
Supplemental Material
Download Zip (622.1 KB)Data availability statement
The datasets supporting the conclusions of this article are included within the article and its additional files.