
Figures & data
Figure 1. Study design, information of datasets and intra-cohort validation result. (a) Overview of analysis workflow. 361 human gut microbiome case-control (controls only include health phenotype) studies about 134 diseases from a public database were preserved, of which 69 projects about 20 diseases were ultimately selected. Then different modeling methods and cross-cohort (external) validation on the same disease and data type were performed, which are influenced by the cohort size (n) of same disease. First, all diseases with n ≥ 2 were enrolled by intra-cohort modeling (i.e., building single-cohort classifiers). Second, only diseases with n ≥ 3 were performed leave-one-dataset out (LODO) analysis (one of combined-cohort modeling). Thirdly, only diseases with n ≥ 5 were enrolled by cohort-cumulation modeling (CCM) and sample-cumulation modeling (SCM) analyses (two of combined-cohort modeling, Methods). (b) Disease information about filtered 83 cohorts. There are five broad categories of diseases, where Mental diseases represent Mental and Nervous system diseases. Colors represent different data types. The numbers on the graph represent cohort size for each disease on each data type. (c) Density plot of the No. of samples in each cohort. The median sample sizes of case and control are 48 and 47, marked by the red and blue lines, respectively. (d) Comparation of internal validation AUCs with intra-cohort modeling between different disease categories. Multiple adjusted two sides Wilcoxon rank sum test was used for pairwise group comparisons. (e) Comparation of internal validation AUCs with intra-cohort modeling between three different data types (Only diseases with both 16S and mNGS sequencing types were included). (f) Comparation of AUCs with intra-cohort modeling between internal and external validations in overall. Two sides Wilcoxon rank sum test was used for comparisons. (g) Comparation of AUCs with intra-cohort modeling between internal and external validations in Intestinal, Metabolic, Mental, Autoimmune and Liver five disease categories. Two sides Wilcoxon rank sum test was used for pairwise group comparisons. The colored horizontal lines represent different AUC levels. The numbers marked in the bottom of d, e, f and g represent the mean of the corresponding AUCs. *p < 0.05, **p < 0.01, ***p < 0.001, ****p < 0.0001.
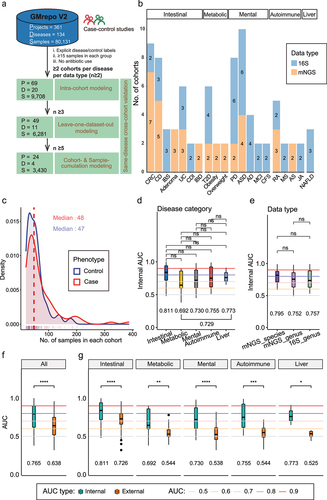
Figure 2. Comparation of external validation with intra-cohort modeling under different disease categories and data types. (a) Comparation of external validation AUCs with intra-cohort modeling between five different disease categories. Multiple adjusted two sides Wilcoxon rank sum test was used for pairwise group comparisons. Kruskal–Wallis test was used for multiple-group comparisons (p < 2.2e − 16). (b) Comparation of external validation AUCs with intra-cohort modeling between three different data types. Kruskal–Wallis test was used for multiple-group comparisons (p = 2.5e − 12). (c) Boxplots of external validation AUCs under different disease categories in each data type. Points represent the external validation AUCs, and colors represent the different disease categories. Kruskal–Wallis test was used for multiple-group comparisons and p values were shown at the top of the picture. Multiple pairwise Wilcoxon rank sum test comparisons were adjusted and p values were shown above the line segment. Box elements show the median and upper and lower quartiles. (d) Boxplots of external validation AUCs between different data types in each disease category. BD (Only diseases with both 16S and mNGS sequencing types were included.
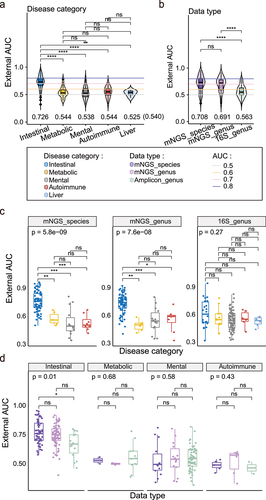
Figure 3. ANOVA analysis and comparation of external validation with intra-cohort modeling in detail. (a) Two-factor with interaction (data type * disease category) ANOVA of external AUCs. The R2 and p values of the factors were shown above the box. (b) Two-factor with interaction (disease category * data type) ANOVA of external AUCs. The R2 and p value of the factors were shown above the box. (c) Boxplots of external validation AUC under five disease categories in 16S genus data (dataset excluded IBD). Points represent the external validation AUCs, and colors represent the different disease categories. Kruskal–Wallis test was used for multiple-group comparisons and p value was shown at the top of the picture. Multiple pairwise Wilcoxon rank sum test comparisons were adjusted and p values were shown above the line segment. Box elements show the median and upper and lower quartiles. (d) Boxplots of external validation AUCs between mNGS species and 16S genus in intestinal disease which only included disease with all three data types, including CD, CRC and UC). Colors represent the different data types. Two sides Wilcoxon rank sum test was used and p values were shown above the picture. Box elements show the median and upper and lower quartiles.
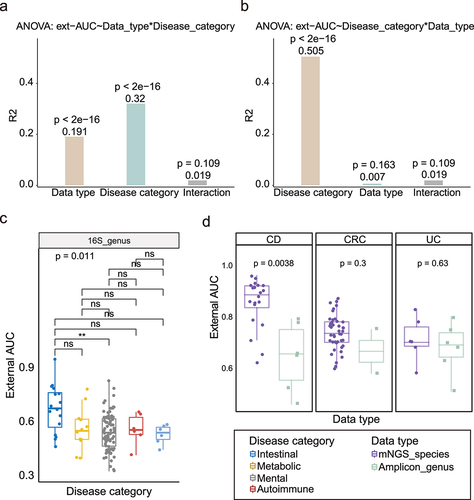
Figure 4. The improvement of the external validation in LODO and Cohort-Cumulation modeling. (a) Left: Comparation of median external validation AUCs between intra-cohort and LODO modeling method under non-intestinal diseases. Each point represents the median external AUC of each cohort (as testing dataset). Two-side paired Wilcoxon rank sum test was used for pairwise group comparisons. Right: Comparation of median external validation AUCs between intra-cohort and LODO modeling method under intestinal diseases. (b) Comparation of median external validation AUCs between intra-cohort and LODO modeling method per non-intestinal disease. Two-side paired Wilcoxon rank sum test was used for pairwise group comparisons. (c) External AUCs for the testing datasets at increasing numbers of training cohorts considered for the model (CCM). Non-intestinal diseases with more than or equal to 5 were shown here (including ASD and PD). The green line linked the median external AUC at each number of training datasets. (d) External AUCs for the LODO modeling at increasing numbers of samples considered for the training model (SCM). Non-intestinal diseases with more than or equal to 5 were shown here (including ASD and PD). The green line linked the median external AUC at each number of training datasets. The red line represents the linear regression model of the No. of training samples to median external AUC (Table S4), and Spearman correlation analysis was also carried out (the correlation coefficient and p value were shown at the top).
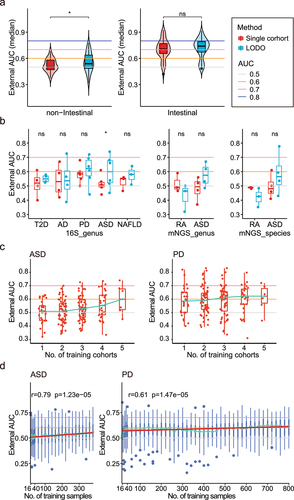
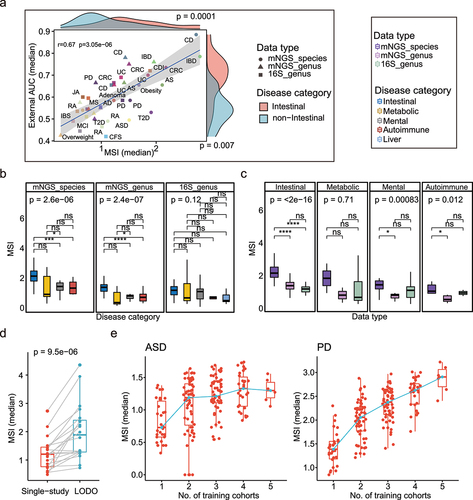
Figure 5. Association between external validation results and Marker Similarity Index (MSI) results. (a) Correlation between the median MSIs and external validation AUCs using intra-cohort modeling of each disease (Spearman r = 0.67 p = 3.05e − 06); the shape and color represent different data types and diseases. The x-axis value of each point represents the median of MSI when dataset under organization of intra-cohort modeling in each disease, and the y-axis value represents the median external validation AUC using intra-cohort modeling in each disease. The density distributions of x- and y-axis between intestinal and non-intestinal diseases were shown at the top and right. Two-side paired Wilcoxon rank sum test was used for pairwise group comparisons. (b) Boxplots of MSIs under different disease categories in each data type. The colors represent the different disease categories. Kruskal–Wallis test was used for multiple-group comparisons and p value was shown at the top of the picture. Multiple pairwise Wilcoxon rank sum test comparisons were adjusted and p values were shown above the line segment. Box elements show the median and upper and lower quartiles. (c) Boxplots of MSIs between different data types in each disease category. Dataset only included disease with all three data types. (d) Comparation of median MSIs when dataset under organization of intra-cohort and LODO modeling method in each disease. Two-side paired Wilcoxon rank sum test was used for pairwise group comparisons. (e) Median MSIs calculated from dataset under organization of CCM. The green line linked the median MSI at each number of training datasets. Non-intestinal diseases with more than or equal to 5 were shown here (including ASD and PD).
Supplemental Material
Download Zip (8.4 MB)Data availability statement
The processed data and codes that support the findings of this study are available in GitHub repository at https://github.com/whchenlab/GMModels. These data were derived from the following resources available in the public domain: NCBI (https://www.ncbi.nlm.nih.gov/sra), ENA (https://www.ebi.ac.uk/ena/browser/), MGnify (https://www.ebi.ac.uk/metagenomics/), GMrepo v2 (https://gmrepo.humangut.info), and the accession codes were in TableS1.