
Figures & data
Figure 1. Propionate intake attenuates the eosinophilic airway inflammation and Th2 cytokine production in a murine HDM-induced asthma model. (a) Schematic depiction of the experimental protocol. Details are described in the methods section. (b-e) the percentage (b, d) and absolute number (c, e) of inflammatory cells in the bronchoalveolar lavage (b, c) and lung (d, e) were evaluated 72 h after the last HDM challenge. Data are mean ± SD. *p < 0.05 and **p < 0.01 by one-way ANOVA and Tukey’s test. (f) Representative photomicrographs of lung sections with hematoxylin and eosin staining and histological inflammatory scores. Bars = 50 µm. Data are mean ± SD. *, *p < 0.05 and **p < 0.01 by one-way ANOVA and Tukey’s test. (g, h) the percentage of IL-5-, IL-13, IL-17A, or IFN-γ-producing CD4+ cells in the mediastinal lymph node (mLN) (g) and bronchoalveolar lavage (BAL) (h) by flow cytometry intracellular staining analysis. Data are mean ± SD. *p < 0.05 by one-way ANOVA and Tukey’s test.
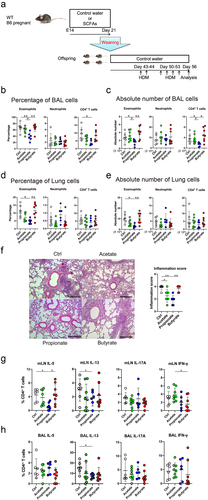
Figure 2. GPR41 deficiency eliminates the inhibitory effect of oral propionate administration in a murine HDM-induced asthma model. (a) Schematic depiction of the experimental protocol. Details are described in the methods section. (b-e) the percentage (b, d) and absolute number (c, e) of eosinophils in the bronchoalveolar lavage (b, d) and lung (c, e) were evaluated 72 h after the last HDM challenge. Data are mean ± SD. *p < 0.05 and **p < 0.01 by student’s t-test. (f) Representative photomicrographs of lung sections with hematoxylin and eosin staining and histological inflammatory scores. Bars = 50 µm. Data are mean ± SD. *, *p < 0.05 and **p < 0.01 by Student’s t-test. (g, h) the percentage of IFN-γ-, IL-4-, IL-5-, IL-13, or IL-17A-producing CD4+ cells in the mediastinal lymph node (mLN) (g) and bronchoalveolar lavage (BAL) (h) cells by flow cytometry intracellular staining analysis. Data are mean ± SD. *p < 0.05 by student’s t-test.
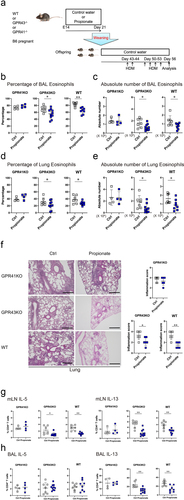
Figure 3. The inhibitory effect of propionate was eliminated despite GPR41 expression by the mother.(a) Schematic depiction of the experimental protocol. (b-e) the percentage (b, d) and absolute number (c, e) of neutrophils and CD4+ T cells in the bronchoalveolar lavage (b, d) and lung (c, e) were evaluated 72 h after the last HDM challenge. Data are mean ± SD. *p < 0.05 and **p < 0.01 by student’s t-test. .
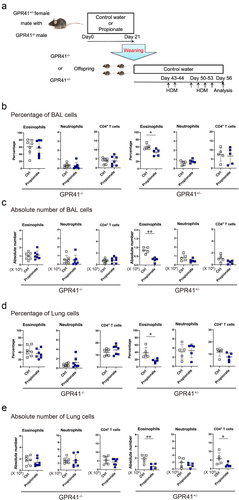
Figure 4. TLR family genes are upregulated in intestinal eosinophils of offspring born from mice fed with propionate (a) Expression levels of Gpr41 mRNA were evaluated by qPCR in eosinophils, B cells, CD4+ T cells, and CD8+ T cells isolated by FACS from small intestinal lamina propria (SILP) and lung cells of wild-type C57BL/6 mice. (b) Schematic depiction of the experimental protocols for isolation of mRnas used in (c-e). (c) Heatmap of differentially expressed genes (DEGs) between the Propionate group and Control water group and a list of the genes upregulated (middle) and downregulated (right) in the Propionate group. (d) Bar plots of the combined score for gene ontology (GO) term enrichment in GO biological processes for DEGs between the propionate group and the Control water group. (e) Expression levels of Tlr2, Tlr8 and Trl9 mRNA in wild-type and GPR41 knockout SILP eosinophils were evaluated by qPCR. Data are mean ± SD. **p < 0.01 by Student’s t-test. (f) Expression levels of Tlr2, Tlr8 and Trl9 mRNA in lung eosinophils were evaluated by qPCR. Data are mean ± SD. *p < 0.05 and **p < 0.01 by Student’s t-test.
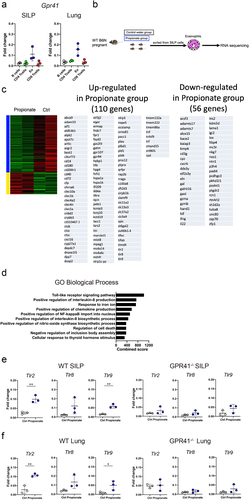
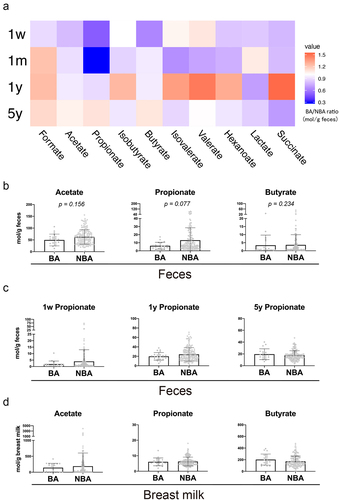
Figure 5. The concentration of fecal propionate was decreased in the human one-month-old BA group compared with the NBA group.Fecal (a-c) and breast milk (d) SCFAs are measured by gas chromatography (a) Heatmap of the ratio of the concentration (mol/g feces) of the ten most abundant fatty acids in feces of the BA group over that of NBA group at 1 week, 1 month, 1 year, and 5 years old. (b) Concentrations of the three most abundant SCFAs in the feces at 1-month-old. Data are mean ± SD. P values based on the Wilcoxon rank-sum test. (c) Concentrations of fecal propionate in the feces at 1 week, 1 year and 5 years old. Data are mean ± SD. P values based on the Wilcoxon rank-sum test. (d) Concentrations of the three most abundant SCFAs in the breast milk when the babies were 1 month old. Data are mean ± SD. P values based on the Wilcoxon rank-sum test.
Supplemental Material
Download Zip (4.5 MB)Data availability statement
The 16S rRNA sequence data that support the findings of this study are openly available in DDBJ Sequence Read Archive at https://www.ddbj.nig.ac.jp/ddbj/index.html, reference number DRA014484.
The RNA sequence dat that support the findings of this study are openly available in Gene Expression Omnibus at https://www.ncbi.nlm.nih.gov/geo/, reference number GSE207711.