
Figures & data
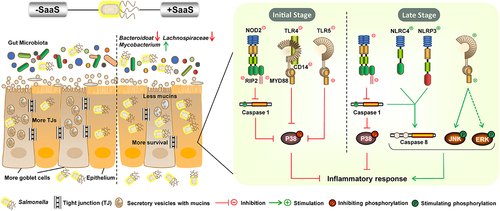
Figure 1. Bacterial dissemination and inflammatory response induced by SaaS in vivo. (a) Bacterial colonization of WT, ΔsaaS and ΔsaaS/psaaS in cecum and colon, and the ratio between bacterial colonization in cecum and bacterial colonization in colon in one mouse; (b) Expression of SaaS in colonized Salmonella in cecum and colon, and half-life of SaaS in the simulated intestinal environment; (c) The concentration of IL-1β, IL-6, TNF-α and iNOS and the expressions of Il18 and Cox2 mRNAs in colon; (d) Representative H&E-stained colonic tissue sections of WT, ΔsaaS and ΔsaaS/psaaS-infected mice (Scale bars, 50 μm). For mRNA expression, the control was set to 1 and indicated by dashed line. Data are represented as means±SD; n = 7–10. Statistical significance was assessed using Student’s t-test. *P < 0.05, **P < 0.01.
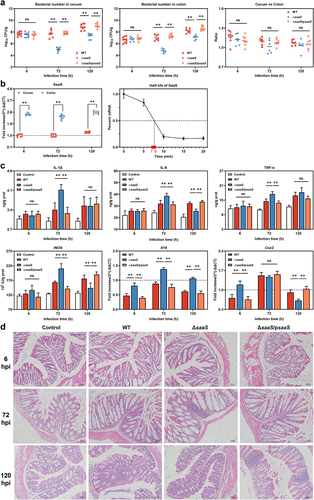
Figure 2. Effects of SaaS on the colonic mucus barrier. (a) Representative AB/PAS-stained colonic tissue sections of WT, ΔsaaS and ΔsaaS/psaaS-infected mice (Scale bars, 50 μm); (b) The number of goblet cells (marked with a black arrow), the thickness of mucus layer, sIgA levels and the expressions of Muc1/2/4 mRNA; (c) Expressions of mucin biosynthesis genes including B3gnt6 and St6galnac1. For mRNA expression, the control was set to 1 and indicated by dashed line. Data are represented as means±SD; n = 7–10. Statistical significance was assessed using Student’s t-test. *P < 0.05, **P < 0.01.
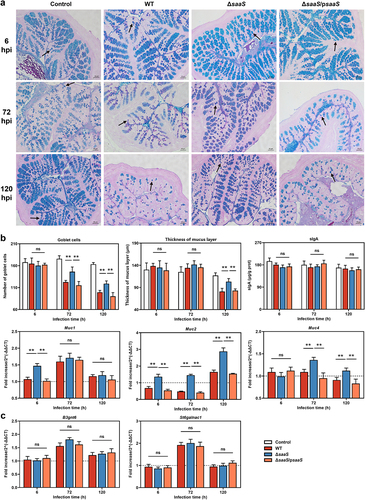
Figure 3. Effects of SaaS on the colonic antimicrobial products and physical barrier. (a) Expressions of antimicrobial product genes including Cryptdin1/4/5, Reg3g, Reg3b, Pla2g2a, Camp, and Lyz; (b) Invasion and survival of S. Enteritidis to Caco-2 cells, LDH release of Caco-2 cells treated with S. Enteritidis and the expressions of Zo1, Ocln and Cldn mRNA. For mRNA expression, the control was set to 1 and indicated by dashed line. Data are represented as means±SD; n = 7–10. Statistical significance was assessed using Student’s t-test. *P < 0.05, **P < 0.01.
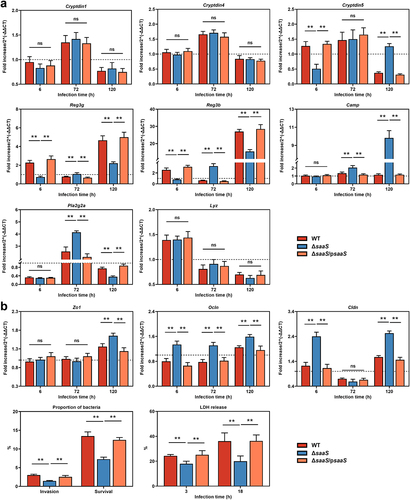
Figure 4. Effects of SaaS on the diversity of colon microbiota. (a) Principal coordinate analysis (PCoA) and clustering analysis at 6 hpi; (b) PCoA and clustering analysis at 72 hpi; (c) Composition of colon microbiota at the phyla levels at 6 and 72 hpi; (d) Composition of colon microbiota at the genera levels at 6 and 72 hpi. (e) Differential microbiota at phyla and genera levels and functional prediction of colonic microbial genes at 6 hpi; (f) Differential microbiota at phyla and genera levels and functional prediction of colonic microbial genes at 72 hpi. hpi: hours after infection. Data are represented as means±SD; n = 7–10. Statistical significance was assessed using Student’s t-test. *P < 0.05, **P < 0.01.
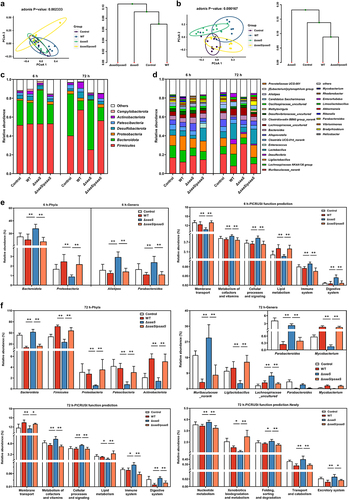
Table 1. Alpha diversity characteristics of gut microbiota.
Figure 5. Altered inflammation levels exhibiting correlations with bacterial burden, intestinal barriers. (a) 6 hpi; (b) 72 hpi; (c) 120 hpi. Red color represents significant positive correlation and white color represents significant negative correlation, and the independent right color bars depict correlation coefficients. hpi: hours after infection. Correlation was considered significant when the absolute value of Spearman’s rank correlation coefficient (Spearman’s r) was > 0.5. *P < 0.05; **P < 0.01.
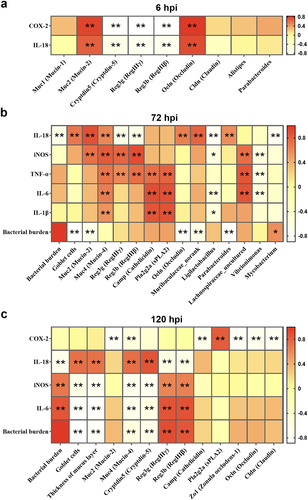
Figure 6. Effects of SaaS on protein expressions in MAPK signaling pathways. (a) Phosphorylation level of ERK in western blotting analysis at 6 hpi; (b) Phosphorylation level of ERK and P38 in western blotting analysis at 72 hpi; (c) Phosphorylation level of ERK, P38 and JNK in western blotting analysis at 120 hpi. hpi: hours after infection. Data are represented as means±SD from three independent experiments. Statistical significance was assessed using Student’s t-test. *P < 0.05, **P < 0.01.
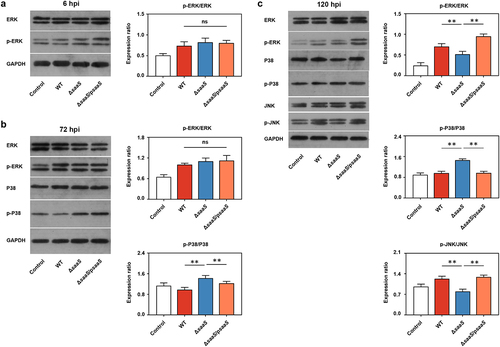
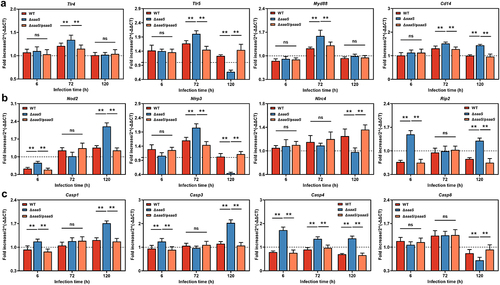
Figure 7. Effects of SaaS on the activation pathway of MAPK in colon. (a) Expressions of toll-like receptor systems including Tlr4, Tlr5, Myd88 and Cd14 mRNA; (b) Expressions of nod-like receptor systems including Nod2, Nlrp3, Nlrc4 and Rip2 mRNA; (c) Expressions of caspase family including Casp1, Casp3, Casp4 and Casp8 mRNA. hpi: hours after infection. For mRNA expression, the control was set to 1 and indicated by dashed line. Data are represented as means±SD; n = 7–10. Statistical significance was assessed using Student’s t-test. *P < 0.05, **P < 0.01.
Supplemental Material
Download MS Word (303.5 KB)Data availability statement
The data that support the findings of this study are available in figshare at https://figshare.com/s/cfe1f4b520b47dd62967.