
Figures & data
Figure 1. Gut microbiota (GM) Comparison between healthy controls, patients with epithelial benign ovarian tumor (EBOT) and epithelial ovarian cancer (EOC). (a) the typical pathological examination results of EBOT and EOC patients (10 × 40 magnification). The fibrous connective tissue was indicated by a yellow arrow, while the ovarian cancer cells were indicated by red arrow. (b) Comparison of alpha diversity indices (Chao1 and Shannon index) among three groups. (c) Venn map representation of amplicon sequence variants (ASVs). (d) principal coordinates analysis (PCoA) with Bray–Curtis distance of β diversity index. (e-g) Microbial composition at the phylum level. The relative abundances of Proteobacteria and Actinobacteria in three groups were analyzed. (h-j) Microbial composition at the genus level. The relative abundances of Bifidobacterium and Ruminococcaceae_ruminococcus in three groups were analyzed. H: healthy controls (n = 20); B: patients with EBOT (n = 20); E: patients with EOC (n = 20). Data are presented in means ± SD. One-way analysis of variance (ANOVA) with Tukey’s test for multiple comparisons. *P < 0.05, **P < 0.01, ****P < 0.0001.
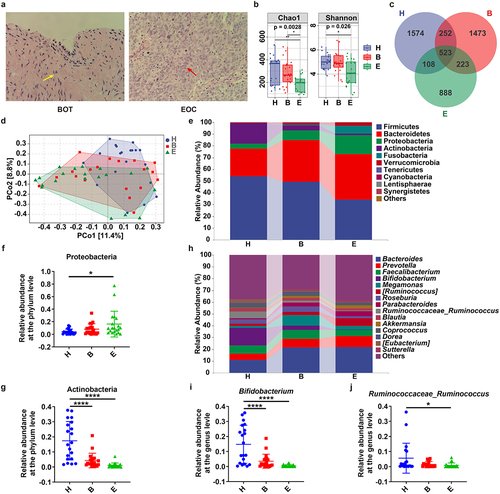
Table 1. Baseline characteristics of patients with EOC and EBOT and healthy controls.
Figure 2. Effects of Abx and FMT on GM and intestinal barrier of the EOC model. (a) After depleting the original GM using mixed broad-spectrum antibiotics (Abx) for 2 weeks, EOC model mice received oral gavage of normal saline (M and Abx group) or fecal microbiota of healthy controls (HT) or patients with EBOT (BT) or patients with EOC (MT) for 11 weeks (three times a week). (b) 16S rRNA sequencing analysis of stool samples at day 90 after treatments of mice described in Fig. 2a (C: controls; M: EOC modeling; Abx: mixed antibiotic feeding after modeling; HT: oral gavage with fecal microbiota of healthy controls after modeling; BT: oral gavage with fecal microbiota of EBOT patients after modeling; MT: oral gavage with fecal microbiota of EOC patients after modeling). PCoA with weighted_Unifrac distance of β diversity index (n = 5). (c) Relative abundance of gut bacterial phylum after treatments with modeling, Abx and FMT versus controls. (d) Microbial composition at the genus level after treatments above six groups. (e) the relative abundance of Bacteroidetes, Actinobacteria, Allobaculum, Bifidobacterium and Aerococcus within each group was analyzed. (f) H&E staining images of intestine tissues were displayed after treatments of mice described in Fig. 2a. (g)Western blot analysis of occludin expression in intestine tissues (n = 3/group). Data are presented in means ± SD. One-way analysis of ANOVA with Tukey’s test for multiple comparisons. *P < 0.05, **P < 0.01.
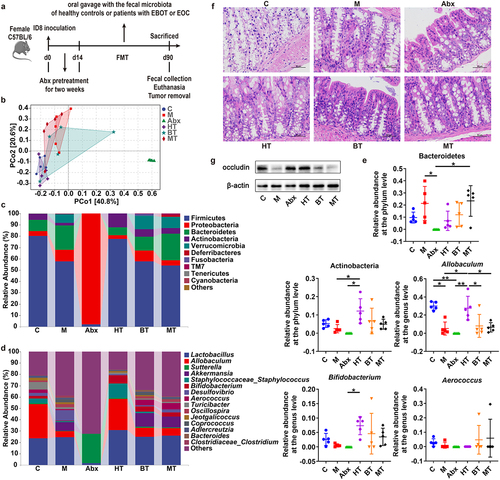
Figure 3. The GM affected cancer progression of EOC model in vivo. (a) Images of tumor with different treatments of mice described in Fig. 2a on 90 day (M: EOC modeling; Abx: mixed antibiotic feeding after modeling; HT: oral gavage with fecal microbiota of healthy controls after modeling; BT: oral gavage with fecal microbiota of patients with EBOT after modeling; MT: oral gavage with fecal microbiota of patients with EOC after modeling). (b) The tumorous weight in M, Abx, HT, BT and MT group on 90 day (n = 5). (c) Changes in tumor volume over time in M, Abx, HT, BT and MT group (n = 5). (d) Changes in body weight of mice over time in M, Abx, HT, BT and MT group (n = 5). (e) Kaplan-Meier survival curves of C57BL/6 mice EOC models in M, Abx, HT, BT, and MT group (n = 9). (f) H&E and immunohistochemistry (IHC) staining images of tumor tissues were presented. Top panel: H&E staining of tumor; Middle panel: Ki67 expression detected by IHC; Bottom panel: Gli1 expression detected by IHC. g Western blot analysis of Shh, Gli1 and Gli2 protein expression in tumor tissues (n = 3/group). Data are presented as means ± SD. Two-way repeated-measures ANOVA, together with Tukey’s test for multiple comparisons, and Log-rank test were performed for survival data e. *P < 0.05, **P < 0.01.
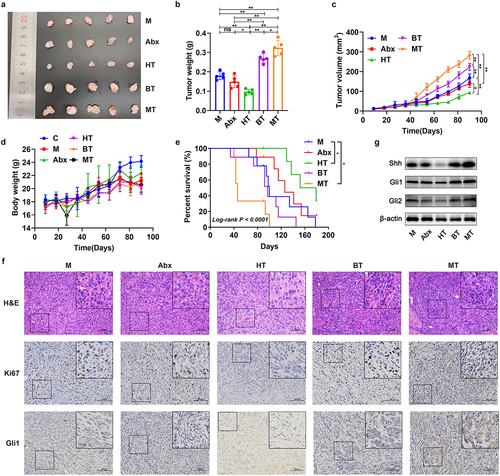
Figure 4. Effects of GANT61 inhibiting Hedgehog signaling on tumor of the EOC model. (a) After depleting the original GM using mixed broad-spectrum antibiotics (Abx) for 2 weeks, EOC model mice received oral gavage of normal saline (M and G groups) or fecal microbiota of patients with EOC (MT and MG groups) for 11 weeks (three times a week) meanwhile corn oil (M and MT groups) or GANT61 peritumoral subcutaneous injection (s.C.) (G and MG groups) were conducted. (b) the weight of tumor in M, G, MT and MG groups on 90 day (n = 5) (M: EOC modeling; G: GANT61 s.C. after modeling; MT: oral gavage with fecal microbiota of patients with EOC meanwhile corn oil s.C. after modeling; MG: oral gavage with fecal microbiota of patients with EOC meanwhile GANT61 s.C. after modeling). (c) Changes in tumor volume over time in M, G, MT and MG groups (n = 5). (d) Changes in body weight of mice over time in M, G, MT and MG groups (n = 5). (e) Kaplan-Meier survival curves of C57BL/6 mice EOC models in M, G, MT and MG groups (n = 9). (f) Western blot analysis of Shh, Gli1 and Gli2 expression in tumor tissues (n = 3/group). (g) H&E and IHC staining images of tumor tissues from each group were presented. Top panel: H&E staining of tumor; Middle panel: Ki67 expression detected by IHC; Bottom panel: Gli1 expression detected by IHC. Data are presented as means ± SD. Two-way repeated-measures ANOVA, together with Tukey’s test for multiple comparisons, and Log-rank test were performed for survival data e. *P < 0.05, **P < 0.01.
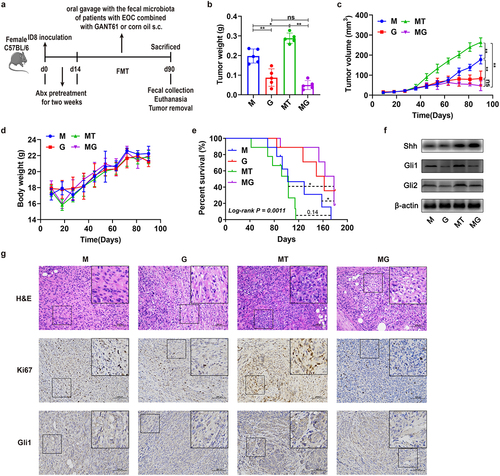
Figure 5. Effects of GANT61 on intestinal barrier damage and NF-κB signaling of EOC model. a H&E staining images of intestine tissues were displayed after treatments of mice in M, G, MT and MG groups. b Western blot analysis of occludin expression in intestine tissues (n = 3/group). The relative expression of proteins occludin were quantified by Image J. c-d Concentrations of TNF-α and IL − 1β in serum from each group described in Fig. 4a at day 90. e Western blot analysis in the expression of TLR − 4, MyD88, p-p65 and p65 in intestine tissues (n = 3). f Western blot analysis in the expression of TLR − 4, MyD88, p-p65 and p65 in tumor tissues (n = 3/group). g-h Western blot analysis of TLR − 4, MyD88, p-p65 and p65 expression in intestine and tumor tissues from each group described in Fig. 2a (n = 3/group). i-j Serum concentrations of TNF-α and IL − 1β from each group described in Fig. 2a at day 90. Data are presented as means ± SD. One-way ANOVA with Tukey’s test for multiple comparisons; ANOVA, analysis of variance. *P < 0.05, **P < 0.01.
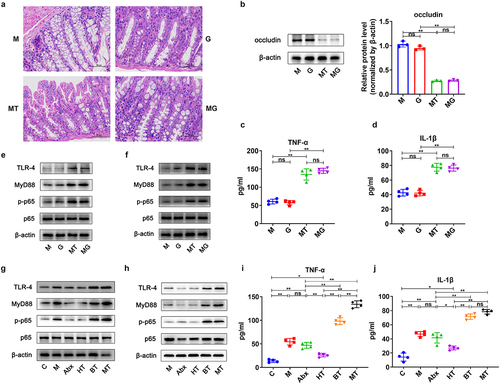
Figure 6. Effects of parthenolide (PTL) inhibiting NF-κB signaling on tumor of the EOC model. (a) After depleting the original GM using mixed broad-spectrum antibiotics (Abx) for 2 weeks, EOC model mice received oral gavage of normal saline (M and P groups) or fecal microbiota of patients with EOC (MT and MP groups) for 11 weeks (three times a week) meanwhile PBS (M and MT groups) or PTL intraperitoneal injection (i.P.) (P and MP groups) were conducted. (b) the weight of tumor in M, P, MT and MP groups on 90 day (n = 5) (M: EOC modeling; P: PTL i.P. after modeling; MT: oral gavage with fecal microbiota of patients with EOC after modeling; MP: oral gavage with fecal microbiota of patients with EOC meanwhile PTL i.P. after modeling). (c) Changes in tumor volume over time in M, P, MT and MP groups (n = 5). (d) Changes in body weight of mice over time in M, P, MT and MP groups (n = 5). (e) Kaplan-Meier survival curves of C57BL/6 mice EOC models in M, P, MT and MP groups (n = 9). (f) Western blot analysis in the expression of TLR − 4, MyD88, p-p65 and p65 in tumor tissues (n = 3/group). (g) H&E and IHC staining images of tumor tissues were displayed. Top panel: H&E staining of tumor; Middle panel: Ki67 expression detected by IHC; Bottom panel: Gli1 expression detected by IHC. (h) Western blot analysis in the expression of Shh, Gli1 and Gli2 protein in tumor tissues (n = 3/group). Data are presented as means ± SD. Two-way repeated-measures ANOVA, together with Tukey’s test for multiple comparisons, and Log-rank test were performed for survival data e. *P < 0.05, **P < 0.01.
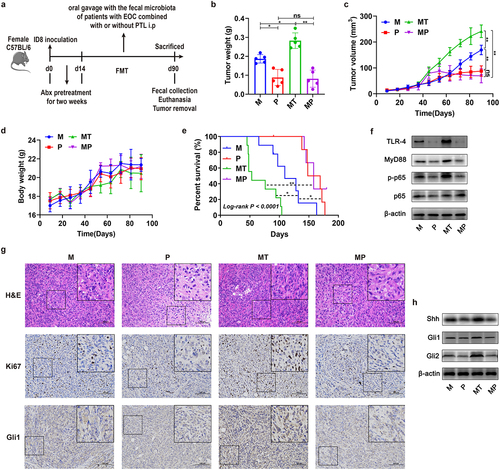
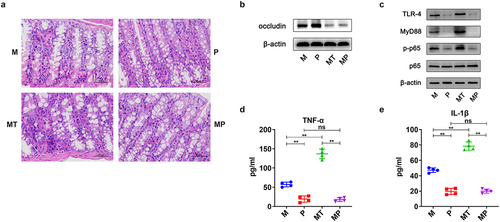
Figure 7. Effects of PTL on intestinal barrier damage of the EOC model. a H&E staining images of intestine tissues were presented after treatments of mice from M, P, MT and MP groups. b Western blot analysis in the expression of occludin in intestine tissues (n = 3/group). c Western blot analysis in the expression of TLR − 4, MyD88, p-p65 and p65 in intestine tissues (n = 3/group). d-e Serum concentrations of TNF-α and IL − 1β from each group described in Fig. 6a at day 90. Data are presented as means ± SD. One-way ANOVA with Tukey’s test for multiple comparisons. *P < 0.05, **P < 0.01.
Supplemental Material
Download Zip (7.5 MB)Data availability statement
The data used to support the findings of this study are available from the corresponding author upon request, and the raw data of 16S rRNA sequencing generated in this study has been deposited under NCBI SRA BioProject numbers PRJNA900393 (https://www.ncbi.nlm.nih.gov/bioproject/PRJNA900393) and PRJNA900513 (https://www.ncbi.nlm.nih.gov/bioproject/PRJNA900513).