
Figures & data
Figure 1. Analysis of the α-diversity (a-d) and beta-diversity (e) of gut bacterial community. Lowercase letters above the error bars indicate significant differences among groups.
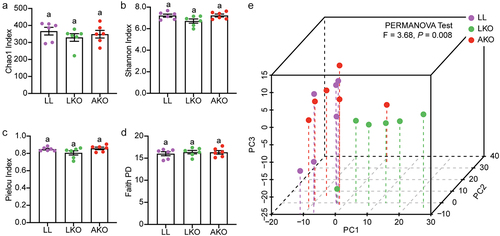
Figure 2. Taxonomic composition of gut bacterial community in LL, LKO, and AKO mice. (a) Composition of the bacterial community in different mouse groups at the phylum level. (b) Comparison of the relative abundance of these phyla among different mouse groups. (c) Composition of the top 30 most abundant genera in different mouse groups. (d) Heatmap illustrating the variations in top 30 genera among different mouse groups. The significantly altered genus were shown in red in the heatmap. Different lowercase letters above the error bars and in the heatmap indicate significant differences among groups.
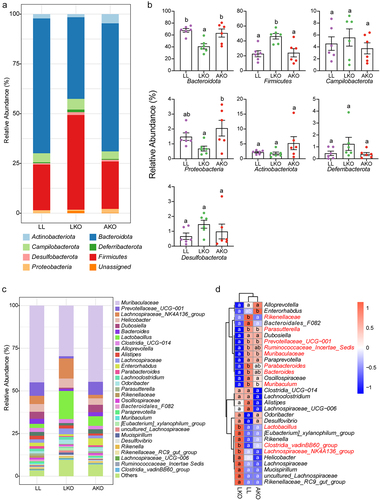
Figure 3. Correlation analysis of gut bacterial phyla and liver metabolites by WGCNA. (a) Metabolite modules obtained based on the 214 metabolites in the liver in LL, LKO, and AKO mice. (b) Heatmap presenting module–trait relationships based on the Pearson method. Each row corresponds to a module eigengene (ME) and each column to the abundance of a bacterial phylum. The corresponding correlation coefficient is displayed at the top of the cell, and corresponding P value for each module is displayed by the star. *: P < 0.05, **: P < 0.01, ***: P < 0.001. (c-d) The relationship between module membership (MM) in blue module and biomarker significance (BS) of Bacteroidota (c) and Firmicutes (d). The MM of a node represents the correlation between the node profile and the ME, and the BS of a node represents the correlation between the node profile and a given trait. The greater absolute value of the MM indicates the node is more highly representative of the module, and the greater absolute value of the BS represents the node is more biologically significant.
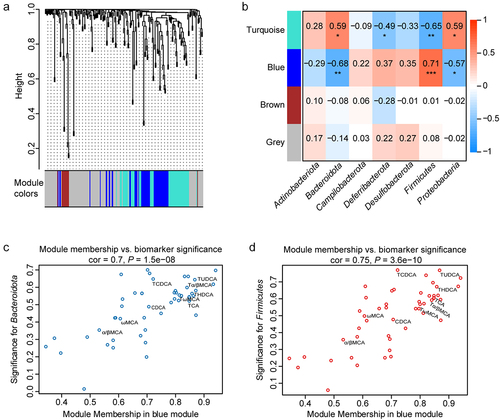
Figure 4. Change of the bile acid profile in different mice. (a) Composition of the liver bile acid pool in LL, LKO, and AKO mice. (b-c): Fold change of total bile acid and 12-OH bile acids in the liver (b) and serum (c) between the LL and LKO group. (d) Ratio of 12-OH bile acids to non-12-OH bile acids in the liver and serum of LL and LKO mice. (e) Content of serum C4 in LL and LKO mice. *: P < 0.05, **: P < 0.01, ***: P < 0.001.
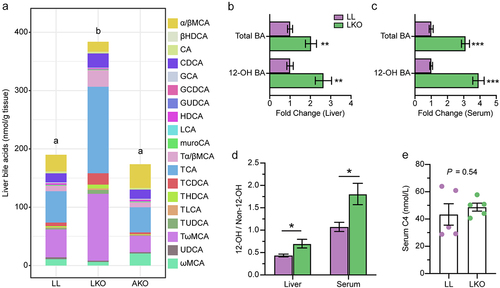
Figure 5. Analysis of bile acid metabolism regulation by hepatic GH signaling. (a) Expression level of genes related to bile acid metabolism in the liver of LL and LKO mice. (b-c) Expression level of Cyp8b1 in rhGH treated HFD fed mice (b) and HepG2 cells (c). (d) Expression level of hepatic Fxr and Shp in LL and LKO mice. (e) Expression level of hepatic Fxr and its downstream Shp and MafG in LKO mice after GW4064 treatment. (f) Expression level of hepatic Cyp8b1 in the GW4064 treated LKO mice. *: P < 0.05, **: P < 0.01, ***: P < 0.001.
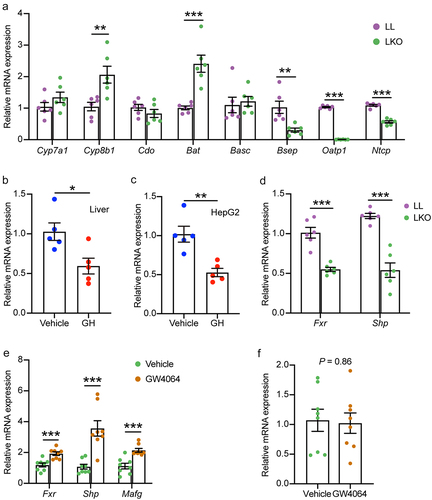
Figure 6. Bile acid metabolism in the cecum and its correlation with gut bacteria. (a) OPLS-DA plot showing the difference of bile acid profile between the LL and LKO mice. (b) Composition of the cecal bile acid pool in the LL and LKO mice. (c-e) Comparison of the abundance of primary bile acid (c), secondary bile acid (d) and conjugated bile acid (e) between the LL and LKO mice. (f) Expression level of the genes related to bile acid reabsorption. (g) Correlation between the bile acid and the top 30 most abundant bacterial genera. *: P < 0.05, **: P < 0.01, ***: P < 0.001.
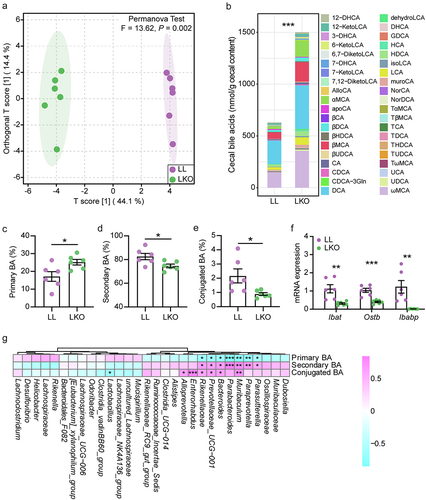
Figure 7. Prediction of gut microbiota function by Tax4Fun2. (a) OPLS-DA plot showing the difference of gut microbiota function at the KO level in the LL and LKO mice. (b-c) Comparison of the relative abundance of 7α-HSDH gene (b) and BSH gene (c) between the LL and LKO mice. *: P < 0.05, **: P < 0.01, ***: P < 0.001. (d) LDA analysis revealing the differentially enriched functional pathways between the LL and LKO mice.
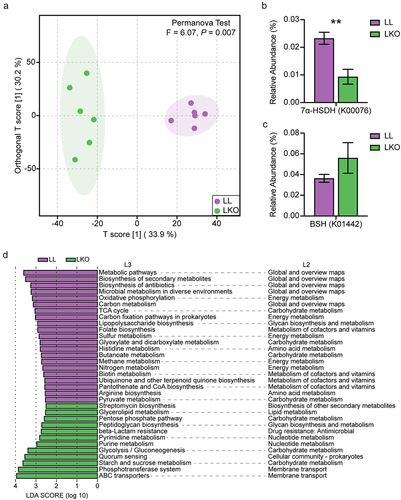
Figure 8. Analysis of the SCFA profile in cecal content of the LL and LKO mice. (a) Composition of SCFA pool in the LL and LKO mice. (b-e) Comparison of the individual SCFA content in the LL and LKO mice. *: P < 0.05, **: P < 0.01, ***: P < 0.001.
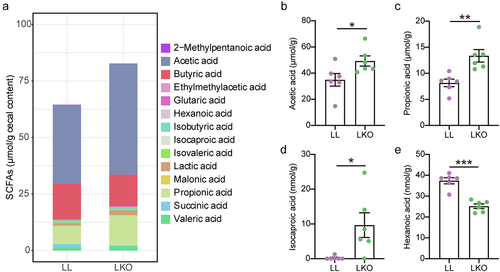
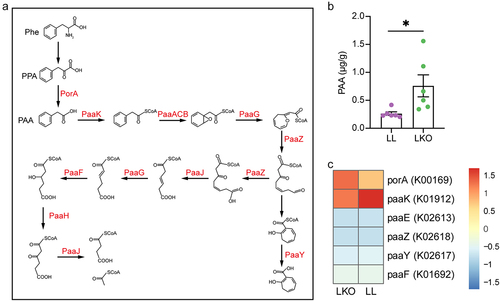
Figure 9. PAA metabolism in the LL and LKO mice. (a) Schema of bacterial PAA metabolism pathway. (b) Comparison of liver PAA content between the LL and LKO mice. (c) Relative abundance of PAA metabolism genes predicted by Tax4Fun2 in the cecal content of LL and LKO mice.
Supplemental Material
Download Zip (5.5 MB)Data availability statement
The raw sequence data are available in the NCBI Sequence Read Archive database under accession number PRJNA913256 (http://www.ncbi.nlm.nih.gov/sra). The targeted metabolomics data are included in the supplementary files.