
Figures & data
Figure 1. TRF efficiently ameliorated Western diet-induced obesity and NASH progression. (a) Schematic diagram of the animal experimental design. (b) Mouse body weight curve. (c) Curve of blood glucose levels during the OGTT. (d) Serum levels of ALT, AST, ALP and TC. (e) Representative images of H&E staining of liver (upper panel, original magnification × 20, scale bar = 400 mm) and the NAFLD activity score (NAS, lower panel). (f) Representative images of Oil red O staining of liver (upper panel, original magnification × 20, scale bar = 400 mm) and quantitative analysis of the Oil red O area (lower panel). (g) Representative images of Sirius red staining of liver (upper panel, original magnification × 20, scale bar = 400 mm) and quantitative analysis of the Sirius red area (lower panel). n = 10 in each group. The data are presented as the mean ± SEM. *p < 0.05; **p < 0.01, ***p < 0.001 for the comparison.
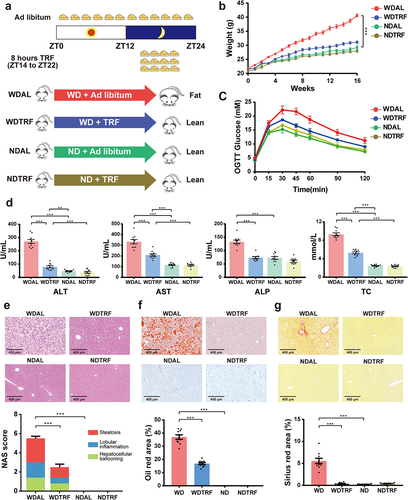
Figure 2. TRF reconstituted the composition of the gut microbiota. (a) Schematic diagram of fecal sampling design over a 24-hour period. (b) Unweighted UniFrac PCoA plot. (c) Stacked bar plot of the relative abundances of phyla with significant changes (Kruskal-Wallis test). (d) Relative abundances of significantly changed phyla (Kruskal-Wallis test). n = 48 in each group. The data are presented as the mean ± SEM. *p < 0.05; **p < 0.01, ***p < 0.001 for the comparison.
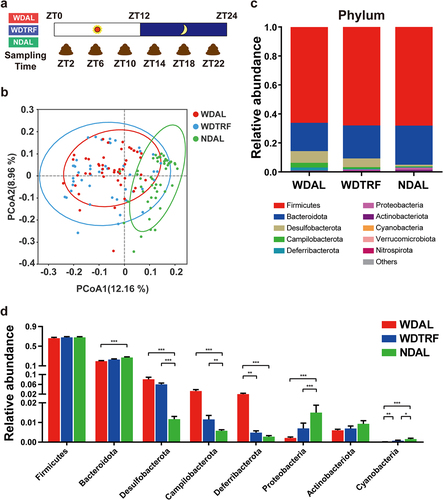
Figure 3. TRF reinstated microbial rhythmicity in WD-fed mice. (a) Dynamic changes in microbial composition at the phylum level over a 24-hour period. (b) Heatmaps of genera with significant rhythmicity in each group. (c) Relative abundance percentages of cyclical and noncyclical genera averaged across all time points. (d) Diurnal oscillations of several genera over the course of a day. n = 8 at each time point in each group. The data are presented as the mean ± SEM.
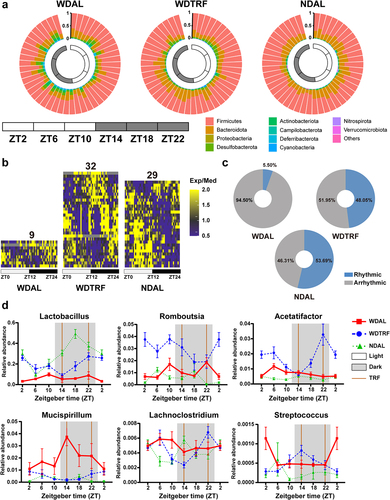
Figure 4. Rhythmic microbiota orchestrated periodic fluctuations in intestinal metabolites. (a) PCA plot of the fecal metabolome. (b) the constitution of differential metabolites in the comparisons of the WDAL vs. NDAL groups and WDTRF vs. WDAL groups. (c) Heatmaps of metabolites with significant rhythmicity in each group. (d) KEGG pathway enrichment analysis of rhythmic metabolites in the WDTRF group. (e) Correlation heatmap of rhythmic genera and rhythmic metabolites. Red represents a positive correlation, and blue represents a negative correlation. n = 6 at each time point in each group. *p < 0.05; **p < 0.01, ***p < 0.001 for the comparison.
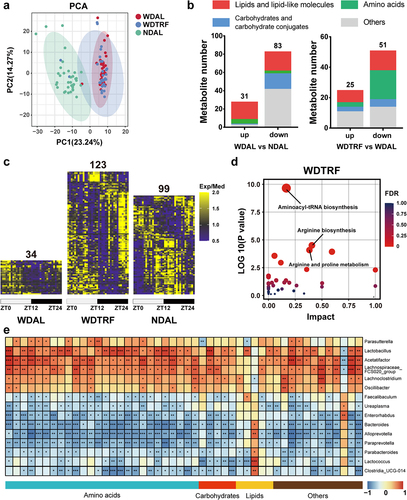
Figure 5. WDTRF feeding phase-derived microbiota alleviated WD-induced steatohepatitis. (a) Schematic diagram of the FMT experimental design. (b) Mice body weight. (c) Curve of blood glucose levels during the OGTT. (d) Representative images of H&E staining of the liver (left panel, original magnification × 20, scale bar = 400 mm) and NAS (right panel). (e) Representative flow cytometry plots of macrophages (left panel) and quantitative analysis of cell percentages (right panel). n = 8 in each group. The data are presented as the mean ± SEM. *p < 0.05; **p < 0.01, ***p < 0.001 for the comparison.
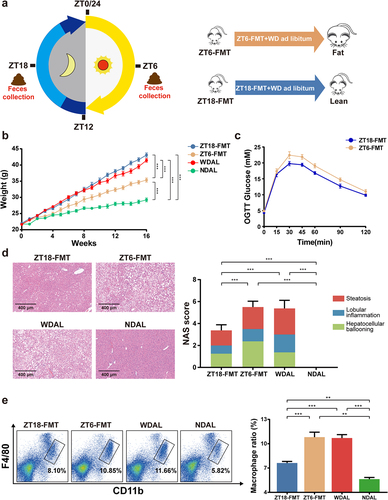
Figure 6. WDTRF feeding phase-derived microbiota modulated the alterations in hepatic transcriptional expression during NASH. (a) PCA plot of the liver transcriptome. (b) Heatmap of DEGs in the ZT18-FMT group versus the ZT-6 FMT. (c) the top 12 pathway terms in KEGG pathway enrichment analysis. (d) Heatmap of the hub genes in three clusters of the PPI network. (e) Visualization of hub genes of serotonergic synapses. n = 3 in each group.
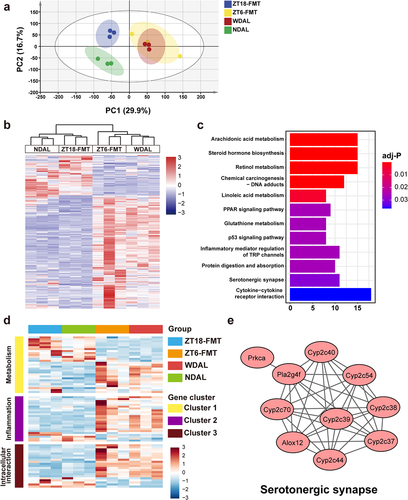
Figure 7. ZT18-FMT treatment modulated the microbial composition and rhythmicity in NASH mice. (a) Unweighted UniFrac PCoA plot. (b) Relative abundances of significantly changed phyla (Mann-Whitney U test). (c) Discriminative taxa with LDA score > 3.5 in LEfSe analysis. (d) Heatmaps of genera with significant rhythmicity in each group. (e) Relative abundance percentages of cyclical and noncyclical genera averaged across all time points. (f) Diurnal oscillations of several genera over the course of a day. n = 6 at each time point in each group. The data are presented as the mean ± SEM. *p < 0.05; **p < 0.01, ***p < 0.001 for the comparison.
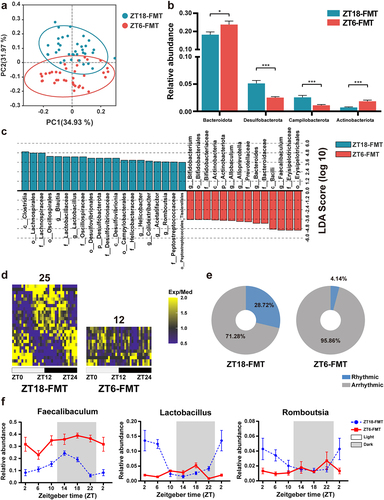
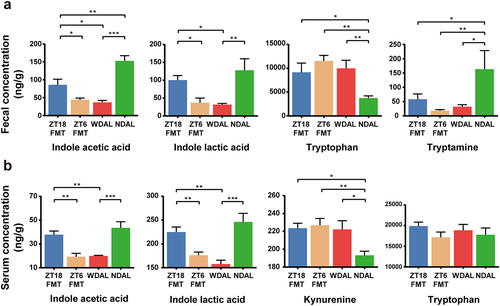
Figure 8. WDTRF feeding phase-derived microbiota rejuvenated microbial production of tryptophan derivatives. (a) Fecal concentrations of tryptophan derivatives (indole acetic acid, indole lactic acid, tryptophan and tryptamine). (b) Serum concentrations of tryptophan derivatives (indole acetic acid, indole lactic acid, kynurenine and tryptophan). n = 8 in each group. The data are presented as the mean ± SEM. *p < 0.05; **p < 0.01, ***p < 0.001 for the comparison.
Supplemental Material
Download PDF (10.6 MB)Data availability statement
The 16S rRNA gene sequencing data are available at NCBI’s Sequence Read
Archive (SRA) database under the BioProject accession code PRJNA923159 at https://www.ncbi.nlm.nih.gov/bioproject/PRJNA923159 and PRJNA951532 at https://www.ncbi.nlm.nih.gov/bioproject/PRJNA951532. The raw data of RNA sequencing are available at SRA database under the BioProject accession code PRJNA923592 at https://www.ncbi.nlm.nih.gov/bioproject/PRJNA923592.