
Figures & data
Figure 1. BT4338 is required for Roc synthesis. (a) Colony blot analysis of selected mutants harboring transposon insertions in BT1222 (GT3148), BT1221 (GT3150), or BT4338 (GT3151) compared to a control strain (GT1663) grown on solid minimal media containing rhamnose and galactose. Each strain is represented by at least 10 different isogenic colonies. (b) Western blot analysis of Roc from wild-type (GT593) or Bt strains deficient for BT4338 (GT1234) or fusA2 (GT1310) during growth in glucose (glu; −5) or 15-, 60-, and 180-minutes following exposure to carbon limitation (No C). (c) Quantified western blot analysis of wild-type (GT593; black), or Bt strains deficient for BT4338 (GT1234; gray), or fusA2 (GT1310; green) during growth in glucose (glu; −5) and 60-min following exposure to carbon limitation (No C) (n = 4 biological samples; error bars represent SEM; P values derived from two-way ANOVA; n.s. indicates P values ≥0.05; ***P < 0.001; ****P < 0.0001). (d) Western blot analysis of BT4338 (GT1481) during mid-exponential growth in glucose (glu; −5) or fructose (fru; −5) or 15-, and 60-minutes following exposure to carbon limitation (No C). (e) Western blot analysis of Roc from the strains described in (b) following mid-exponential growth in glucose (glu), fructose (fru), galactose (gal), or mannose (man). (f) Western blot analysis of BT4338 (GT1481) during mid-exponential growth in glucose (glu), fructose (fru), galactose (gal), or mannose (man). Blots were probed using anti-HA and anti-GroEL antibodies.
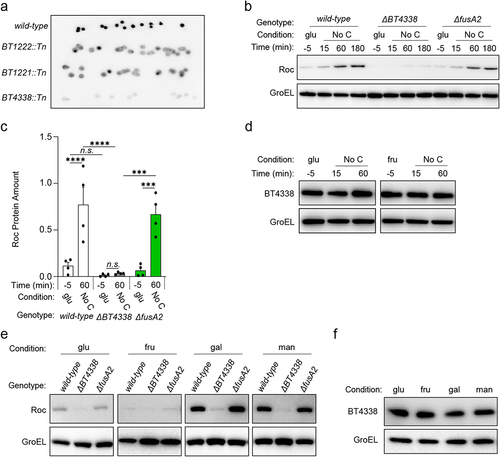
Figure 2. BT4338 governs Roc levels via its 5’ mRNA leader. (a) Western blot analysis of Roc from engineered strains harboring the roc leader and ORF positioned downstream of its native (GT530) or heterologous (GT670) promoters, or strains with the native roc promoter upstream of a heterologous 5’ leader region (GT665) in strains encoding BT4338 or a BT4338-deficient background (GT3509, GT3511, and GT3510, respectively) grown in minimal media containing 0.5% glucose (glu), fructose (fru), galactose (gal), or mannose (man) as the sole carbon source. (b) Western blot analysis of BT3334 from engineered strains harboring the BT3334 promoter and ORF flanking either the BT3334 (GT534) or roc (GT663) leaders in isogenic strains encoding BT4338 or in a BT4338-deficient background (GT3512 and GT3514, respectively) grown in minimal media containing 0.5% glucose (glu), fructose (fru), galactose (gal), or mannose (man). (c) Western blot analysis of Roc from strains described in (a) during mid-exponential growth in glucose (glu, −5) or 15-, and 60- minutes following exposure to carbon limitation conditions. (d) Western blot analysis of BT3334 from strains described in (b) during mid-exponential growth in glucose (glu, −5) or 15-, and 60-minutes following exposure to carbon limitation conditions. Blots were probed using anti-HA and anti-GroEL antibodies.
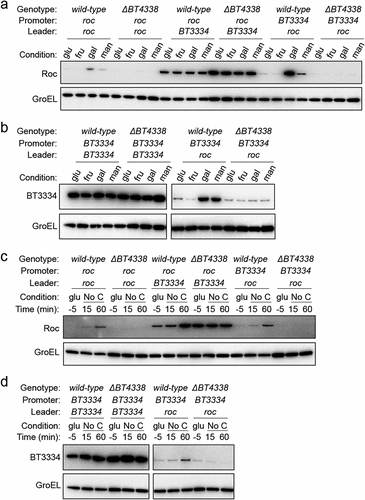
Figure 3. BT4338 DNA binding activity is stimulated during carbon starvation. (a – b) ChIP analysis of the fusA2 (BT2167; black) and roc (BT3172; red) promoter regions from wild-type Bt (GT1481) cells grown to mid-exponential phase in minimal media containing (a) glucose (glu; −5) or (b) fructose (fru; −5) and 10 minutes following exposure to carbon limitation conditions (n = 8 biological samples; error bars represent SEM; P values derived from two-way ANOVA; n.s. indicates P values ≥0.05; ****P < 0.0001).
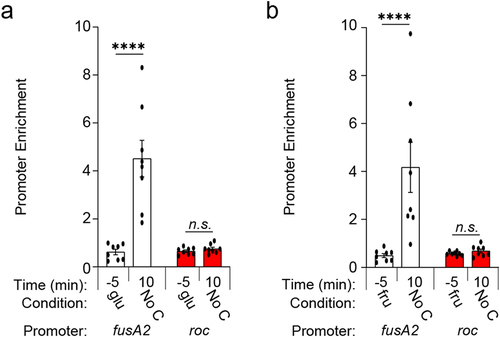
Figure 4. Dietary sugars silence BT4338 activity. (a & b) the relative abundances of bar-coded strains wild-type (GT3361; black) or BT4338-deficient Bt strains harboring an empty vector (GT3522; blue) or complementation plasmid (GT3363; pink) at the indicated times following gavage with equal cfus of each strain into germ-free mice fed (a) a sugar-rich diet or (b) a standard diet (n = 5; error bars represent SEM). (c) qPCR analysis of fusA2 (BT2167) or BT4295 transcript levels measured in wild-type (GT593; black) or BT4338-deficient (GT1234; gray) Bt strains during mid-exponential growth in 1% PMOG (n = 4 biological samples; error bars represent SEM, P values derived from two-way ANOVA; n.s. indicates P values ≥ 0.05; **P < 0.01 ***P < 0.001). (d – e). qPCR analysis of (d) fusA2 (BT2167) or (e) BT4295 transcript levels measured in wild-type Bt (GT23) during mid-exponential growth in either 0.5% glucose (glu) or 1% PMOG, and 10-minutes following the addition of 0.2% glucose to the PMOG grown cells. (n = 9 biological samples; error bars represent SEM, P values were calculated using two-way ANOVA; n.s. indicates P values ≥0.05; ***P < 0.001; ****P < 0.0001). (f) Western blot analysis of BT4338 from cells (GT1481) grown in 1% PMOG or 10 and 60-minutes following the addition of glucose to 0.2%. Blot was probed using anti-HA and anti-GroEL antibodies.
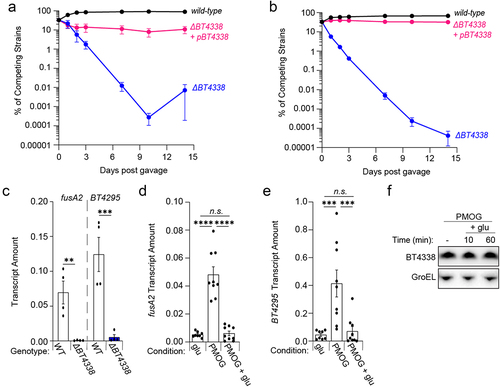
Figure 5. BT4338-orthologs govern a conserved regulon among prominent Bacteroides species. (a) the transcript level of B. fragilis fusA2 (BF9343_3536) was measured in wild-type (ATCC 25285; black) or a BF9343_0915-deficient (GT2520; blue) B. fragilis strain grown in glucose (glu; −5) and 10-minutes after exposure to carbon limitation (No C) (n = 3 biological samples; error bars represent SEM, P values were calculated using two-way ANOVA; n.s. indicates P values ≥0.05; ****P < 0.0001). (b) the transcript level of B. ovatus fusA2 (BACOVA_03178) was measured in wild-type (ATCC 8483; black) or BACOVA_05152-deficient (GT2413; purple) strains grown in glucose (glu; −5) or 10-minutes after exposure to carbon limitation (No C) (n = 3 biological samples; error bars represent SEM, P values derived from two-way ANOVA; n.s. indicates P values ≥ 0.05; ****P < 0.0001). (c) the transcript level of B. vulgatus fusA2 (BVU_0017) was measured in wild-type (ATCC 8482; black) or BVU_3580-deficient (GT2399; red) strains grown in glucose (glu; −5) or 10-minutes after exposure to carbon limitation (No C) (n = 3 biological samples; error bars represent SEM, P values derived from two-way ANOVA; n.s. indicates P values ≥ 0.05; ****P < 0.0001). (d – e). Growth of bar-coded wild-type (solid lines) B. thetaiotaomicron (Bt; GT3361; black), B. fragilis (Bf; GT3551; blue), B. vulgatus (Bv; GT3367; red), or B. ovatus (Bo; GT3364; purple) or bar-coded isogenic BT4338-ortholog-deficient strains (dashed lines; GT3522, GT3555, GT3643, GT3553, respectively) in minimal media containing 0.5% (d) fucose or (e) xylose (n = 4 biological samples; error bars represent SEM). (f) Western blot analysis of BT1635 amounts from wild-type (GT4372) or a Bt strain deficient for BT4338 (GT4373) during growth in glucose (glu; −5) or 15-, or 60-minutes following exposure to carbon limitation (No C). (g) Western blot analysis of BACOVA_04371 from wild-type Bo (GT4362) or a strain deficient for BACOVA_05152 (GT4369) during growth in glucose (glu; −5) or 15-, or 60-minutes following exposure to carbon limitation (No C). Blots were probed using anti-HA and anti-GroEL antibodies.
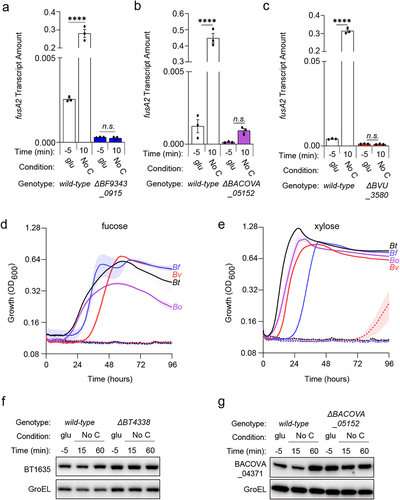
Figure 6. A BT4338-ortholog is silenced by dietary sugar addition in B. fragilis. (a) Bf fusA2 (BF9343_3536) transcript levels were measured in wild-type (ATCC 25285; black) or a BF9343_0915-deficient (GT2520; blue) B. fragilis strain grown in 0.5% glucose, 1% PMOG, or 1% PMOG 10-minutes after addition of 0.2% glucose (n = 3 biological samples; error bars represent SEM, P-values derived from two-way ANOVA; n.s. indicates P values ≥ 0.05; ****P < 0.0001). (b) the transcript level of B. fragilis fusA2 (BF9343_3536) was measured in wild-type (ATCC 25285) or a BF9343_0915-deficient (GT2520) strain during mid-exponential growth in either 0.5% fructose (fru) or 1% PMOG, and 60-minutes following the addition of fructose to 0.2% (n = 9 biological samples for fru and PMOG; n = 3 for PMOG + fru; error bars represent SEM, P values derived from one way ANOVA; n.s. indicates P values ≥ 0.05; *P < 0.05 ****P < 0.0001).
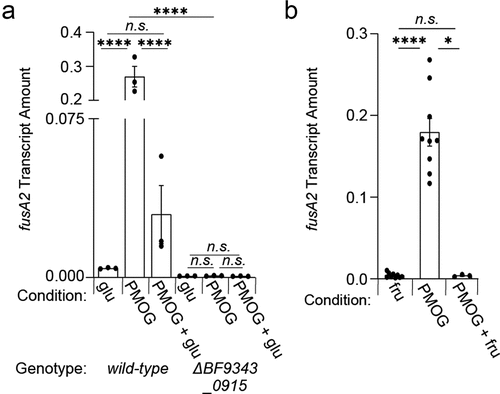
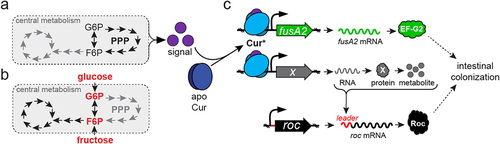
Figure 7. Model depicting the consequences of glucose and fructose on Cur activity. (a) an unknown signal(s) (purple) is putatively synthesized in response to metabolic cues derived from the PPP pathway that converts apo-Cur (dark blue) to Cur* (light blue). (b) Introduction of fructose or glucose modulate central metabolism to reduce Cur signal(s), thereby hindering products necessary for intestinal colonization. (c) Cur* increases transcription of fusA2 (green) and an unidentified gene (gray), whose product(s) govern Roc abundance by interacting with the roc mRNA leader region (red).
Supplemental Material
Download MS Word (868.7 KB)Data availability statement
The authors confirm that data supporting the findings in this study are available within the article and the indicated supplementary materials. Specific data points are openly available at doi: 10.17632/md44b9h2r5.1.