
Figures & data
Figure 1. Akkermansia muciniphila protected against NASH in high-fat-diet mice. The body weight (a) and food intake (b) of mice were recorded. The blood glucose levels (c) and area under the curve (AUC) of the glucose tolerance test (GTT) at the 11th week (d) were recorded. The levels of fasting glucose (e) and TC (f) in serum were examined by biochemical tests at 18 weeks. (g-i) the levels of serum ALT and AST were measured at 8, 12, 16, 18 and 20 weeks. Data are shown as the mean ± SEM or the median with interquartile range. (j) Representative images of hepatic hematoxylin & eosin (H&E) staining. Scale bar, ×200 (left), ×400 (right). The blue arrows indicate the steatohepatitis foci of inflammation with clusters of inflammatory cells. (k) Liver NAFLD activity score (NAS) ratio. n = 8 mice/group. p values were determined using one-way ANOVA or the Kruskal‒Wallis test. *p < 0.05, **p < 0.01, ***p < 0.001. Groups: NC, normal chow control; HFD, high-fat diet; HFD + AKK, high-fat diet and oral treatment with Akkermansia muciniphila.
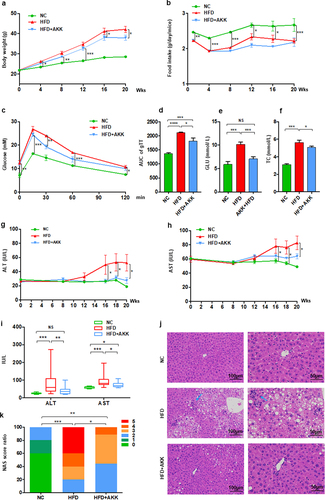
Figure 2. Akkermansia muciniphila decreased hepatic γδT17 cells and proinflammatory macrophages in NASH mice. (a) Representative flow cytometric analysis and (b) percentages of hepatic γδT cells were quantified by flow cytometry. Plots were gated on CD3+ T cells. (c) Representative flow cytometric analysis and (d) percentages of hepatic IL − 17+ γδT cells were quantified by flow cytometry. (e) Representative flow cytometric analysis of proinflammatory macrophages (Ly6C+ CD206− cells) and anti-inflammatory macrophages (Ly6C− CD206+ cells). Plots were gated on macrophages (F4/80+ CD11b+ cells). Percentages of proinflammatory macrophages (f) and anti-inflammatory macrophages (g) among macrophages were quantified by flow cytometry. (a-g) n = 8 mice/group. (h) Heatmap of differentially expressed marker genes in macrophages between the HFD and HC groups or the HFD+AKK and HFD groups. The log2 (fold change) values were calculated from the fragments per kilobase of transcript per million (FPKM) values of RNA sequencing. n = 5 mice/group. (i) Qrt‒PCR analysis of Retlna expression in the liver. n = 8 mice/group. Data are shown as the mean ± SEM or the median with interquartile range. p values were determined using one-way ANOVA or the Kruskal‒Wallis test. *p < 0.05, ** p < 0.01, *** p < 0.001. Groups: NC, normal chow control; HFD, high-fat diet; HFD + AKK, high-fat diet and oral treatment with Akkermansia muciniphila.
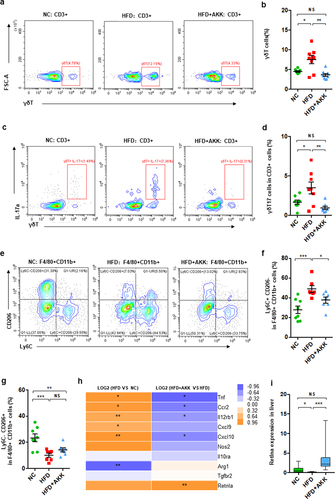
Figure 3. Hepatic γδT cells and proinflammatory macrophages were enriched in NASH patients and were controlled by antibiotics in HFHCD mice. (a and b) the percentages of hepatic macrophages were quantified by single-cell RNA sequencing. (c) the percentages of hepatic proinflammatory macrophages (M1 cells) and anti-inflammatory macrophages (M2 cells) and (d) the percentages of hepatic αβT cells and γδT cells in healthy controls and NAFL and NASH patients. Groups: HC, healthy controls, n = 3; NAFL, nonalcoholic fatty liver patients, n = 3; NASH, nonalcoholic steatohepatitis patients, n = 3. (e) Representative flow cytometric analysis of proinflammatory macrophages (Ly6C+ CD206− cells) and anti-inflammatory macrophages (Ly6C− CD206+ cells). Plots were gated on macrophages (F4/80+ CD11b+ cells). The percentages of proinflammatory macrophages (f) and anti-inflammatory macrophages (g) among macrophages were quantified by flow cytometry. (h) Representative flow cytometric analysis and (i) percentages of hepatic γδT cells were quantified by flow cytometry. Plots were gated on CD3+ T cells. (j) the percentages of hepatic IL − 17+ γδT cells were quantified by flow cytometry, and (k) representative flow cytometric analysis. n = 8 mice/group. (l and m) the levels of serum ALT and AST were measured at 18 weeks. (e-m) n = 10 mice/group. Groups: NC, normal chow control; HFHCD, high-fat high-carbohydrate diet; HFHCD + ABX, high-fat high-carbohydrate diet and oral treatment with antibiotics. Data are shown as the mean ± SEM or the median with interquartile range. p values were determined using one-way ANOVA or the Kruskal‒Wallis test. *p < 0.05, ** p < 0.01, *** p < 0.001.
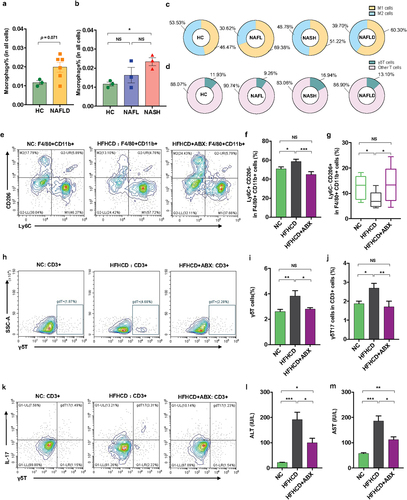
Figure 4. Akkermansia muciniphila treatment decreased the hepatic expression of microbiota-related TLR2 in NASH mice. (a) the hierarchical cluster analysis of hepatic inflammation-related genes measured by RNA sequencing was based on the log2 fold change of the fragments per kilobase of transcript per million (FPKM) values in each sample divided by the group area of the NC. (b) the gene expression of hepatic TNF-α was measured by RNA sequencing. (a and b) n = 5 mice/group. (c) Qrt‒PCR analysis of TNF-α expression in the liver. n = 8 mice/group. (d) the gene expression of hepatic TLR1 and TLR2 was measured by RNA sequencing. n = 5 mice/group. (e and f) the expression of TLR1 and TLR2 in the liver was measured by Qrt‒PCR analysis. n = 8 mice/group. Data are shown as the mean ± SEM. p values were determined using one-way ANOVA. *p < 0.05, ** p < 0.01, *** p < 0.001. Groups: NC, normal chow control; HFD, high-fat diet; HFD + AKK, high-fat diet and oral treatment with Akkermansia muciniphila.
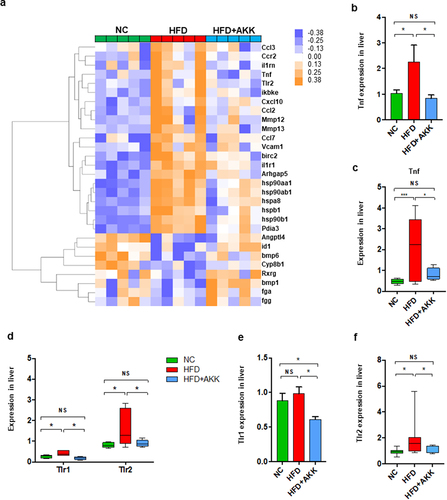
Figure 5. Recovery of Akkermansia muciniphila protected against intestinal barrier failure in HFD-fed NASH mice. (a) PCA score plot. (b) NMDS score plot. (c) PCoA score plot based on Bray‒Curtis distance matrices. Each spot represents one sample. Green, NC; Red, HFD; Blue, HFD+AKK. (d) Continuous monitoring to determine the colonization of Akkermansia muciniphila. (e) the relative abundance of Akkermansia muciniphila at 20 weeks was determined by qPCR. n = 8 mice/group. (f) in vivo gut permeability was determined by measurement of plasma concentrations of FITC-dextran (4 kDa) at 7, 14, and 18 weeks of treatment. (g) ELISA to measure serum LPS concentrations at 19 weeks of treatment. (a-d) n = 8 mice/group. (h and i) Quantitative analysis of mucus thickness (h) and representative image of mucin expression in the colon by immunofluorescent staining in paraffin sections (i). Muc2, green; DNA, blue. Scale bar, ×400 (left), ×800 (right). Pictures are representative of 5 biological replicates. (j) Heatmap of differentially expressed genes in the tight junction pathway between the HFD and HC groups or the HFD+AKK and HFD groups. The log2 (fold change) values were calculated from the fragments per kilobase of transcript per million (FPKM) values of RNA sequencing. n = 3/group. Data are shown as the mean ± SEM or the median with interquartile range. p values were determined using one-way ANOVA. *p < 0.05, ** p < 0.01, *** p < 0.001. Groups: NC, normal chow control; HFD, high-fat diet; HFD + AKK, high-fat diet and oral treatment with Akkermansia muciniphila.
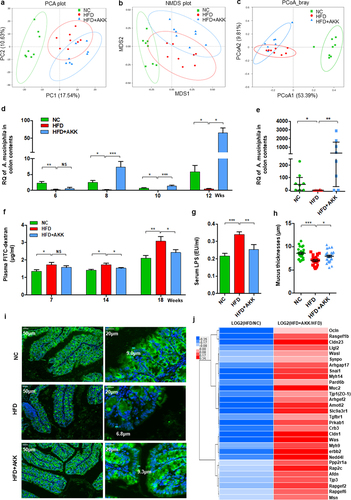
Figure 6. Akkermansia muciniphila regulated intestinal SCFA and tryptophan metabolism in NASH mice. The concentrations of multiple (a) and total (b) SCFAs in the colonic contents were determined by GC/MS. N = 8 mice/group. (c) the gene expression of SCFA receptors in the colon was measured by RNA sequencing. N = 3 mice/group. (d) DPP4 expression in colon tissue was measured by RNA sequencing. N = 3 mice/group. (e) Serum GLP − 1 levels. n = 8 mice/group. (f) Heatmap of the differential tryptophan metabolites in feces between the HFD and HC groups or the HFD+AKK and HFD groups. The log2 (fold change) values were calculated from the normalized area values of untargeted metabolomics profiling. n = 8 mice/group. (g) the gene expression of colonic enzymes in the kynurenine pathway was measured by RNA sequencing. n = 3 mice/group. (h and i) AhR-responsive gene expression (Cyp1a1, Cyp1b1, Ahr and IL −22 r) was measured by RNA sequencing. n = 3 mice/group. Data are shown as the mean ± SEM or the median with interquartile range. p values were determined using one-way ANOVA or the Kruskal‒Wallis test. *p < 0.05, ** p < 0.01, *** p < 0.001. Groups: NC, normal chow control; HFD, high-fat diet; HFD + AKK, high-fat diet and oral treatment with Akkermansia muciniphila.
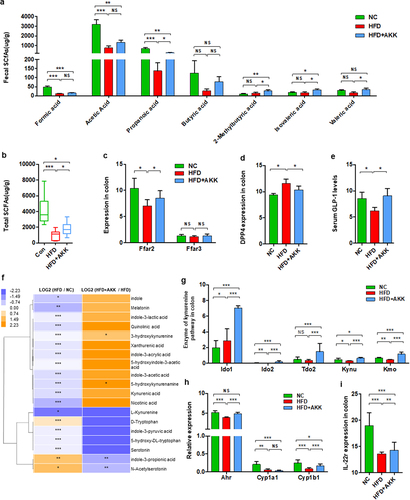
Figure 7. Akkermansia muciniphila decreased hepatic γδT cells by downregulating TLR2 in NASH mice. (a) Representative flow cytometric analysis. The percentages of hepatic γδT cells (b), IL − 17+ γδT cells (c), TLR − 2+ γδT cells (d), proinflammatory macrophages (e) and anti-inflammatory macrophages (f) after lipoteichoic acid (LTA) treatment alone were quantified by flow cytometry. Plots were gated on CD3+ T cells. n = 5 mice/group. (g) Representative flow cytometric analysis and (h) percentages of hepatic γδT cells after LTA and Akkermansia muciniphila treatment were quantified by flow cytometry. Plots were gated on CD45+ cells. (i) Representative flow cytometric analysis and (j) percentages of hepatic TLR − 2+ γδT cells were quantified by flow cytometry. Plots were gated on CD3+ T cells. (g-j) n = 8 or 5 mice/group. (k and l) the levels of serum ALT and AST were measured at 8, 12, 16, 18 and 20 weeks. (m) Representative images of hepatic hematoxylin & eosin (H&E) staining. Scale bar, ×40 (left), ×400 (right). The blue arrows indicate the steatohepatitis foci of inflammation with clusters of inflammatory cells. (n) Proportion chart diagram of the liver NAFLD activity score (NAS) ratio. Data are shown as the mean ± SEM or the median with interquartile range. p values were determined using one-way ANOVA or the Kruskal‒Wallis test. *p < 0.05, ** p < 0.01, *** p < 0.001. Groups: NC, normal chow control; HFD, high-fat diet; HFD + AKK, high-fat diet and oral treatment with Akkermansia muciniphila; HFD + AKK + LTA, high-fat diet and intraperitoneal injection with LTA and oral treatment with Akkermansia muciniphila; LTA, normal chow diet and intraperitoneal injection with LTA.
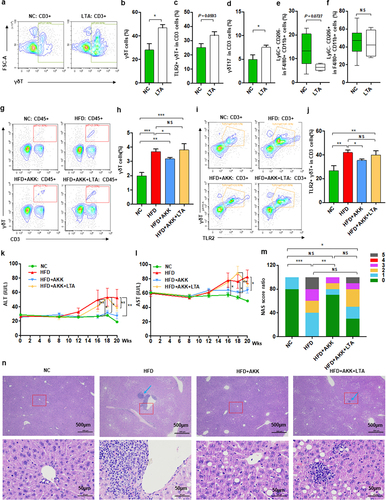
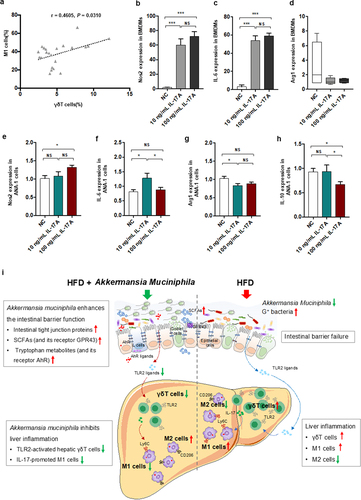
Figure 8. IL − 17 signals promoted macrophage polarization into proinflammatory M1 cells. (a) the relationship between hepatic γδT cells and M1 cells in HFD-induced NASH mice. n = 24 mice. Gene expression of Nos −1 (b), IL − 6 (c) and Arg −1 (d) in bone marrow-derived macrophages (BMDMs) after 10 or 100 ng/mL IL − 17 stimulation. Gene expression of Nos −1 (e), IL − 6 (f), Arg −1 (g) and IL − 10 (h) in Ana −1 cells after 10 or 100 ng/mL IL − 17 stimulation. Data are shown as the mean ± SEM or the median with interquartile range. p values were determined using one-way ANOVA or the Kruskal‒Wallis test. *p < 0.05, ** p < 0.01, *** p < 0.001. (i) Schematic showing the regulatory role of Akkermansia muciniphila in HFD-induced hepatic inflammation. Akkermansia muciniphila enriches intestinal tight junction proteins, SCFAs (and their receptor GPR43), and tryptophan metabolites (and their receptor AhR) and further enhances intestinal barrier function. Following the restoration of intestinal barrier function, Akkermansia muciniphila inhibits liver inflammation by downregulating gut-derived signals (TLR2) in the liver. Specifically, hepatic γδT cells activated by molecules of G+ bacteria (TLR2 ligands) were decreased in HFD mice. Moreover, Akkermansia muciniphila reduced IL − 17-promoted hepatic proinflammatory macrophages (M1 cells).
Supplemental Material
Download MS Word (26.3 MB)Data availability statement
All relevant data are within the paper and its additional files. Raw sequence data of the 16S rRNA gene has been deposited in NCBI (https://www.ncbi.nlm.nih.gov/) under accession code PRJNA783152 and SRP347563. Other data are available on reasonable request.