
Figures & data
Figure 1. Functional annotations of the MD bacterial genomes and growth profiles of A. muciniphila and R. gnavus grown in different media. (a-b) Inconsistent function and CDS for A. muciniphila (a) and R. gnavus (b). Gene predictions by gene callers coincide only if both start and stop codons are predicted to be in the same positions. Several missing and unmatched genes are based on the current functional annotations with different algorithms and databases used. (c-d) Growth curves and fermentation profiles of (c) A. muciniphila grown in BHI and ADM and (d) R. gnavus grown in TSB and defined medium supplemented with various sugars. Growth curves data from (c) were adopted from previous dataCitation40. (e-f) The effects of various nutrients on SCFA production and flux balance analysis for the fermentation products of A. muciniphila (e) and R. gnavus (f).
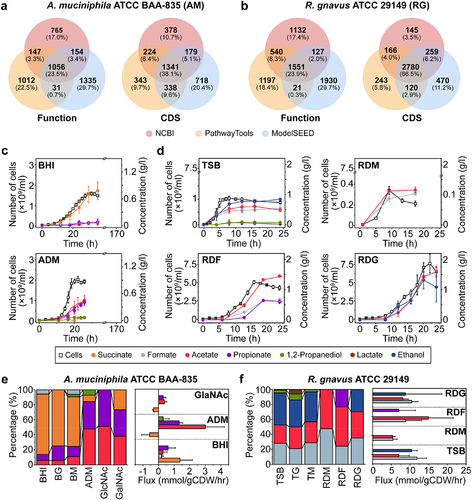
Figure 2. Nutrient-dependent distribution of gene expression for A. muciniphila and R. gnavus. (a) Volcano plot of RNA-seq transcriptome data of A. muciniphila grown in ADM versus BHI. Up represents significantly up-regulated genes [≥2-fold change (FC) in normalized transcripts per million (TPM), P-value (P) <0.05]. (b) Proposed metabolic features when A. muciniphila was grown in ADM versus those when it was grown in BHI. Red color: up-regulated genes and metabolic features in mucin-containing medium. Blue color: up-regulation in each media. (c) Dot plot of enriched analysis performed using the KEGG database when A. muciniphila was grown in ADM versus BHI. (d) Volcano plot of RNA-seq transcriptome data of A. muciniphila grown in ADM versus GalNAc. (e) Proposed metabolic features of A. muciniphila grown in ADM versus GalNAc. (f) Dot plot of results of enrichment analysis when A. muciniphila was grown in ADM versus GalNAc. (g) Volcano plot of RNA-seq transcriptome data of R. gnavus grown in RDM versus TSB. (h) Proposed metabolic features of R. gnavus grown in RDM versus TSB. (i) Dot plot of the results of enrichment analysis when R. gnavus was grown in RDM versus TSB. Dot plot showing the four enriched pathways. (j) Volcano plot of RNA-seq transcriptome data of R. gnavus grown in RDM versus RDF. (k) Proposed metabolic features of R. gnavus grown in RDM versus RDF. (l). Dot plot of results of enrichment analysis when R. gnavus was grown in RDM versus RDF.
![Figure 2. Nutrient-dependent distribution of gene expression for A. muciniphila and R. gnavus. (a) Volcano plot of RNA-seq transcriptome data of A. muciniphila grown in ADM versus BHI. Up represents significantly up-regulated genes [≥2-fold change (FC) in normalized transcripts per million (TPM), P-value (P) <0.05]. (b) Proposed metabolic features when A. muciniphila was grown in ADM versus those when it was grown in BHI. Red color: up-regulated genes and metabolic features in mucin-containing medium. Blue color: up-regulation in each media. (c) Dot plot of enriched analysis performed using the KEGG database when A. muciniphila was grown in ADM versus BHI. (d) Volcano plot of RNA-seq transcriptome data of A. muciniphila grown in ADM versus GalNAc. (e) Proposed metabolic features of A. muciniphila grown in ADM versus GalNAc. (f) Dot plot of results of enrichment analysis when A. muciniphila was grown in ADM versus GalNAc. (g) Volcano plot of RNA-seq transcriptome data of R. gnavus grown in RDM versus TSB. (h) Proposed metabolic features of R. gnavus grown in RDM versus TSB. (i) Dot plot of the results of enrichment analysis when R. gnavus was grown in RDM versus TSB. Dot plot showing the four enriched pathways. (j) Volcano plot of RNA-seq transcriptome data of R. gnavus grown in RDM versus RDF. (k) Proposed metabolic features of R. gnavus grown in RDM versus RDF. (l). Dot plot of results of enrichment analysis when R. gnavus was grown in RDM versus RDF.](/cms/asset/5a1e0d90-3e05-4d39-a013-b031e923411a/kgmi_a_2221811_f0002_oc.jpg)
Figure 3. Mucin-degrading enzyme expression profiles based on transcriptome analysis of MD bacteria. (a-b) Heatmap visualization of the nutrient-dependent expression profiles of enzymes involved in mucin-degradation in A. muciniphila (a) and R. gnavus (b). (c) A. muciniphila-induced cleavage pattern of mucin. (d) R. gnavus-induced cleavage pattern of mucin. *, carbohydrate binding module (CBM). Bold letters: mucin-specific up-regulated enzymes. Regular letters: up-regulation of enzymes in mucin and complex media. Gray letters: the enzymes not up-regulated in media containing mucin.
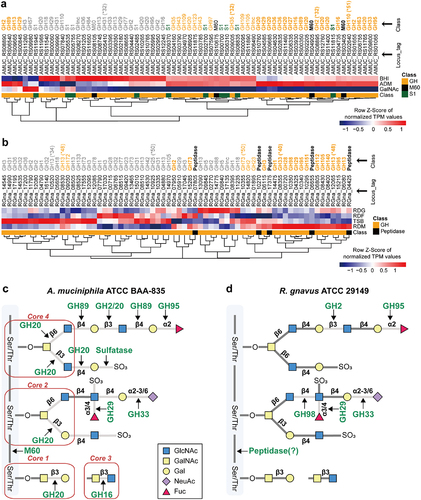
Figure 4. The differential expression of metabolite receptors (a and b) and pro-inflammatory and anti-inflammatory markers (c and d) in macrophages regarding the different nutrients for MD bacteria. (a) mRNA expression of Gpr41, Gpr43, Gpr91, Mrgprd, and Glun2a in RAW 264.7 macrophages treated with culture supernatants of A. muciniphila grown in BHI or ADM for 24 h. (b) mRNA expression of Gpr41, Gpr43, AhR, and Cubn on RAW 264.7 macrophages treated with culture supernatants of R. gnavus grown in TSB, mucin, fucose, or galactose containing medium for 24 h. Results were obtained by RT-PCR and normalized to β-actin expression as relative expression. Uncultured media were used as the control. (c) mRNA expression of Il1b, Il6, Nos2, Il10, and Arg1 on RAW 264.7 macrophages treated A. muciniphila grown in BHI or ADM. (d) mRNA expression of Il1b, Il6, Nos2, Il10, and Arg1 on RAW 264.7 macrophages treated with R. gnavus grown in TSB, mucin, fucose, or galactose-containing media. The results were measured by RT-PCR and normalized with β-actin expression. Data are shown as mean SD, representative of two independent experiments. The comparison was made using a one-way ANOVA test. *P < 0.05, **P < 0.01, ***P < 0.001, ****P < 0.0001.
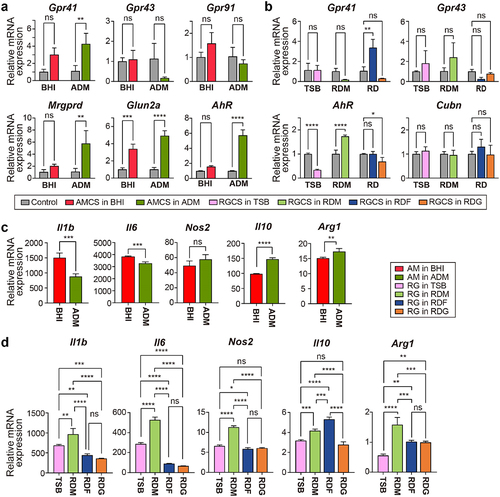
Figure 5. Effects of high-fat diet and high-fiber diet on gut microbiota composition in mice. (a) Schematic of dietary intervention and sample collection. (b) Weekly body weight measurements of mice fed high-fat diet and high-fiber diet (n = 8). (c) Length of colon and weight of iWAT, and eWAT at 6 weeks of diet intervention (n = 8). (d) Inner colonic mucus thickness and goblet cell count (per crypt) (n = 8) (Significance of *P < 0.05 and ****P < 0.0001 was determined by unpaired-t-test). (e) Representative of colonic section stained by Alcian Blue/Periodic Acid-Schiff. (f) Alpha diversity of microbiota from mice fed high-fat diet and high-fiber diet. (g) Principal coordinate analysis of gut microbiota composition based on Bray-Curtis dissimilarity in mice fed high-fat diet and high-fiber diet. (h) Bar plots of gut microbial family composition in mice fed with high-fat diet and high-fiber diet, respectively. *P < 0.05, significant difference between the two groups indicated by asterisk. (i) Growth rates of MD bacteria and probiotics from mice fed high-fat diet and high-fiber diet. The comparison was performed using a paired t-test. *P < 0.05, **P < 0.01, ****P < 0.0001. Outliers are represented with the black diamonds. (j) Metabolic fluxes from mice fed high-fat diet and high-fiber diet.
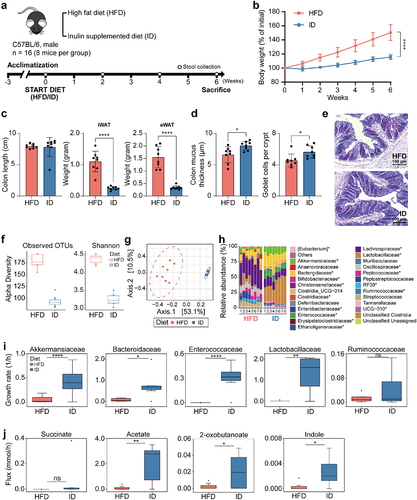
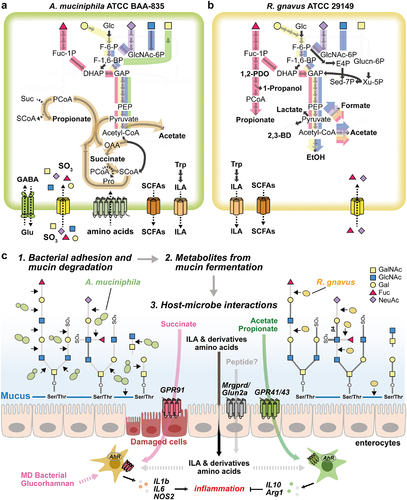
Figure 6. Proposed mechanism of metabolic features of MD bacteria. (a-b) Schematic diagram of the core metabolic pathways of A. muciniphila (a) and R. gnavus (b). The pathway that converts fucose into the core pathways is highlighted in red. Yellow- and purple-colored pathways represent the conversion of galactose and NeuAc into the core pathways, respectively. Blue- and green-colored pathways indicate the conversion of GlcNAc and GalNAc into the core pathways, respectively. Carbon sources described above share the orange-colored pathway for the production of acetate or propionate. (c) The schematic view shows the proposed MD bacterial adhesion and mucin-degradation mechanism, fermentation products, and host-microbe interactions.
Supplemental Material
Download MS Word (55.7 MB)Supplemental Material
Download Zip (8.3 MB)Data availability statement
The complete genome sequence of R. gnavus ATCC 29149 has been deposited in NCBI/GenBank under the accession number CP027002. The RNA-seq data generated in this study have been submitted to the NCBI BioProject database (https://www.ncbi.nlm.nih.gov/bioproject/) under accession number PRJNA967152. Annotation data sets and multi-omics data are available in Datasets and Supplementary File. Detailed materials and methods are available in Supplementary File.