
Figures & data
Figure 1. Excessive dietary iron increases colorectal tumorigenicity in mice. (a) Schematic overview of the AOM/DSS-induced colorectal cancer model. Mice were fed with control diet (ConD) or high-iron diet (HFeD) for 10 weeks. AOM (10 mg/kg) was injected intraperitoneally at day 4. Mice were sacrificed at the end of week 10 (ConD group, n = 6; HFeD group, n = 5). (b – c) Representative images of colonoscope and colon when sacrificed. (d) Tumor numbers in ConD and HFeD mice. (e) Representative images of H&E staining and Ki67-positive cells of colon sections in the ConD group and HFeD group. Scale bars, 250 μm. (f) Quantitation of Ki67 expression in colons. (g) Schematic overview of the transgenic Apcmin/+ cancer model. Mice were fed ConD or HFeD diets for 13 weeks. (h) Tumor number (left) and tumor size (right) in ConD and HFeD mice. (i) Representative images of H&E staining (Scale bars, 1,000 μm) and Ki67-positive cells (Scale bars, 200 μm) of small intestine sections in the ConD group and HFeD group. (j) Quantitation of Ki67 expression in the small intestines. Data are expressed as the mean ± SD. Each data point represents one mouse. Statistical significance was determined by unpaired Student’s t-test and ordinary one-way ANOVA with Tukey’s multiple comparisons. *p < .05, **p < .01. AOM, azoxymethane. DSS, dextran sulfate sodium salt.
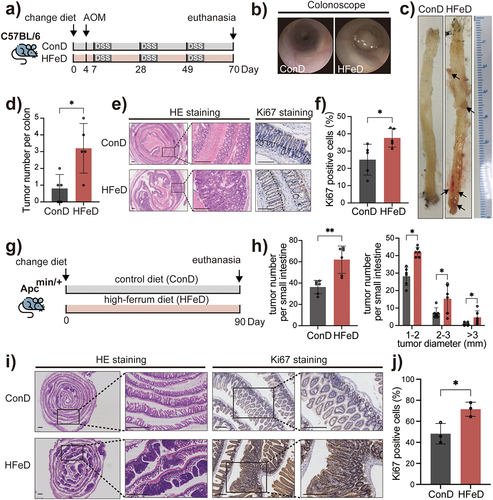
Figure 2. Microbiota modulated by excessive dietary iron increases colorectal tumorigenicity in mice. (a) Representative images of enhanced Perls’ staining (Scale bars, 400 μm) of small intestine sections in the ConD group and HFeD group (left, AOM/DSS model; right, Apcmin/+ model). (b) Gene expression of FTL, Fxn, Glut1, HIF −2a, IRP2, and LCN2 in ConD and HFeD mice (left, AOM/DSS model; right, Apcmin/+ model). (c) Schematic overview of the AOM/DSS-induced cancer model. Mice were treated with an antibiotics cocktail for five days and later underwent washed fecal microbiota transformation for four consecutive days. AOM (10 mg/kg) was injected intraperitoneally at day 0. Mice were sacrificed at the end of week 10 (ConD group, n = 12; HFeD group, n = 12). (d – e) Representative images of colonoscope and colon when sacrificed. (f) Tumor number in ConD and HFeD mice. (g) Representative images of H&E staining and Ki67-positive cells of colon sections in the ConD-FMT group and HFeD-FMT group (Scale bars, 400 μm). Quantitation of Ki67 expression in the colons (right). Data are expressed as the mean ± SD. Each data point represents one mouse. Statistical significance was determined by unpaired Student’s t-test and multiple unpaired Student’s t-test. *p < .05.
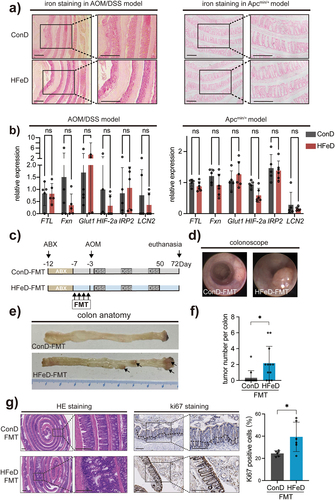
Figure 3. Excessive dietary iron and modulated microbiota impair gut barrier function. (a) LPS concentration in the serum of ConD and HFeD mice (left) or ConD-FMT and HFeD-FMT mice (right). (b) Gene expression of CLDN3 and CLDN8 in ConD and HFeD mice (left) or ConD-FMT and HFeD-FMT mice (right). (c) Representative images of immunofluorescence staining and quantitation of CLDN3 and CLDN8 in AOM/DSS model. (d) Representative images of immunofluorescence staining and quantitation of CLDN3 and CLDN8 in AOM/DSS model with FMT. (e) Staining of total bacteria in the AOM-treated model by fluorescence in situ hybridization in ConD and HFeD mice. (f) Staining of total bacteria in the AOM-treated model by fluorescence in situ hybridization in ConD-FMT and HFeD-FMT mice. Each data point represents one mouse. Data are expressed as the mean ± SD. Statistical significance was determined by unpaired Student’s t-test. *p < .05, **p < .01, ***p < .001, ****p < .0001.
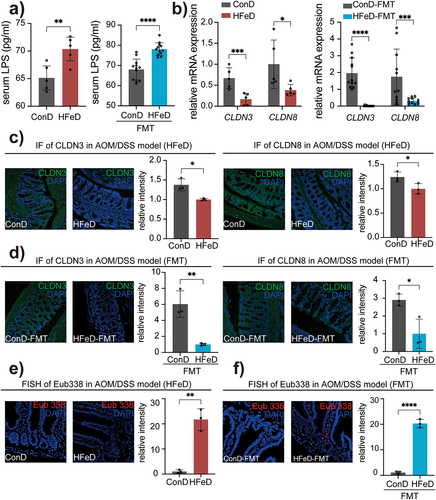
Figure 4. Excessive dietary iron and modulated microbiota induce SLPI expression. (a) Heatmap derived by Reactome annotation showing genes involved in immune regulation pathway. (b) Gene expression (left), protein expression (middle) and quantitation of immunofluorescence staining (right) of SLPI in ConD and HFeD mice (AOM/DSS model). For protein expression analysis and immunofluorescence staining, we randomly selected five mice from each group for analysis. (c) Gene expression (left), protein expression (middle) and quantitation of immunofluorescence staining (right) of SLPI in ConD and HFeD mice (Apcmin/+ model). For protein expression analysis and immunofluorescence staining, we randomly selected six mice from each group for analysis. (d) Gene expression (left), protein expression (middle) and quantitation of immunofluorescence staining (right) of SLPI in ConD-FMT and HFeD-FMT mice (AOM/DSS model). For protein expression analysis and immunofluorescence staining, we randomly selected five mice from each group for analysis. (e) Kaplan–Meier plot showing survival of patients with tumors (N = 9,502) stratified for low and high SLPI expression in primary tumors. (f) Transcription levels of SLPI in colon adenocarcinoma (COAD), pancreatic adenocarcinoma (POAD), rectum adenocarcinoma (READ), stomach adenocarcinoma (STAD), and normal tissue (GEPIA). (H) Gene expression of SLPI in humans that consume more red meat (n = 54) and less red meat (n = 54). Each data point represents one mouse (b-d). Data are expressed as the mean ± SD. Statistical significance was determined by unpaired Student’s t-test. *p < .05, **p < .01, ***p < .001, ****p < .0001.
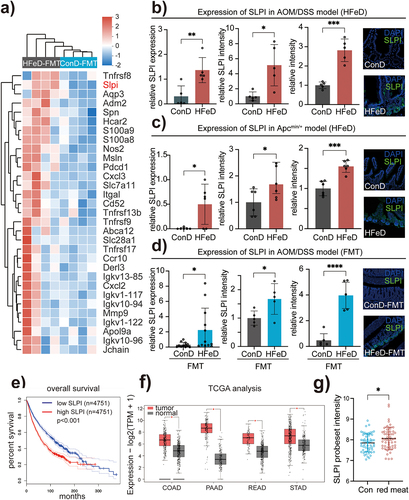
Figure 5. SLPI promotes tumor development both in vivo and in vitro. (a) Representative images and statistical chart of clone formation of CT26 stimulated with PBS (NC) or SLPI (rSLPI). (b) CCK8 assay of CT26 stimulated with PBS (NC) or SLPI (rSLPI). (c – d) Representative images (c) and statistical chart (d) of human-derived tumoroid stimulated with PBS (NC) or SLPI (rSLPI) for seven days. Scale bars, 400 μm. (e – f) in vivo primary tumor growth (e), representative images and statistical chart (f) in mice subcutaneously injected with CT26 and intratumorally injected with PBS (NC) or SLPI. Each data point represents one mouse. (g – h) in vivo primary tumor growth (g), representative images, and statistical chart (h) in mice subcutaneously injected with CT26 pre-treated with PBS (NC) or SLPI for two days. Each data point represents one mouse. (i) Heatmap of genes in the MAPK signaling pathway. (j) Protein expression of phosp-SAPK/JNK in ConD and HFeD mice or ConD-FMT and HFeD-FMT mice determined by western blot. Data are expressed as the mean ± SD. Statistical significance was determined by unpaired Student’s t-test. *p < .05, **p < .01, ***p < .001, ****p < .0001.
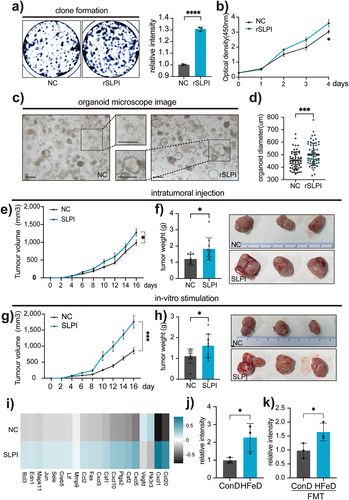
Figure 6. Excessive dietary iron significantly depletes Akkermansiaceae. (a) Alpha diversity (Simpson index) boxplot of mice in ConD (n = 6) and HFeD (n = 5) groups. (b) PCA comparing mouse microbial compositions in fecal samples between ConD and HFeD groups. (c) LDA score computed from features with differential abundance between ConD and HFeD groups; the criterion for feature selection was log LDA score > 3.5. (d) Alpha diversity (Simpson index) boxplot of mice in ConD-FMT (n = 11) and HFeD-FMT (n = 12) groups. (e) PCA comparing mouse microbial compositions in fecal samples between ConD-FMT and HFeD-FMT groups. (f) LDA score computed from features with differential abundance between ConD-FMT and HFeD-FMT groups; the criterion for feature selection was log LDA score > 3.5. (g) Statistical chart of the proportion of differentiated genus in ConD and HFeD groups or ConD-FMT and HFeD-FMT groups. Data are expressed as the mean ± SD. Statistical significance was determined by permutation multivariate analysis of variance (b,e) and unpaired Student’s t-test. *p < .05.
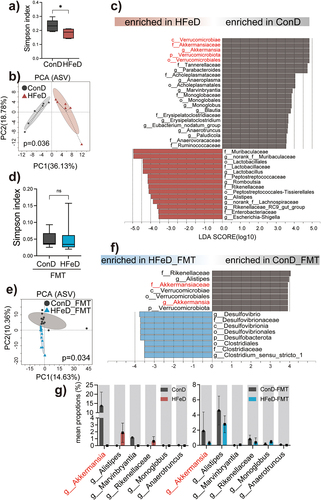
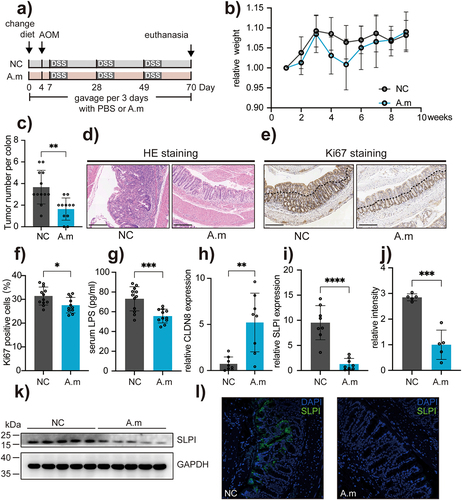
Figure 7. Supplementation of Akkermansiaceae muciphila protects epithelial tumorigenesis against dietary iron. (a) Schematic overview of the AOM/DSS-induced cancer model. Mice were gavaged every three days with PBS (NC) or A. muciphila for 10 weeks. AOM (10 mg/kg) was injected intraperitoneally at day 4. Mice were sacrificed at the end of week 10 (NC group, n = 12; A.M group, n = 11). (b) Weight changes are expressed as the mean change from the starting weight. (c) Tumor number in the mice of NC and A.M groups. (d – e) Representative images of H&E staining and Ki67-positive cells of colon sections in the NC and A.M groups. Scale bars, 200 μm. (f) Quantitation of Ki67 expression in the colons. (g) LPS concentration in the serum of mice from NC and A.M groups. (h) Gene expression of CLDN8 in mice from NC and A.M groups. (i) Gene expression of SLPI in mice from NC and A.M groups. (i – k) Protein expression of SLPI in mice from NC and A.M groups determined by western blot. (l) Protein expression of SLPI in NC and A.M mice determined by immunofluorescence staining. Data are expressed as the mean ± SD. Each data point represents one mouse. Statistical significance was determined by unpaired Student’s t-test. *p < .05, **p < .01, ***p < .001, ****p < .0001.
Supplemental Material
Download Zip (26.1 MB)Data availability statement
The authors confirm that the data supporting the findings of this study are available within the article and its supplementary materials. The 16S rDNA-sequencing data was deposited in the Sequence Read Archive (SRA; https://www.ncbi.nlm.nih.gov/sra) under the accession number: PRJNA907929.