
Figures & data
Figure 1. Culture oxygenation modulates the autotoxicity phenotype of a clbS mutant in a pks+ E. coli. (a) E. coli strain DH10B pBACpks, protein, and the trans-complemented clbS mutant (clbS + clbS), were grown (5 ml LB) with shaking in a standard atmospheric incubator, in 10 ml tubes that were tightly closed, or in 50 ml tubes with the cap opened. (b) the bacteria were cultured with shaking in tubes with cap in vented position, within a hypoxic chamber at 0.1% O2, or in a standard atmosphere incubator (21% O2). After 16 h culture, bacterial growth was determined by plating and counting colony forming units (CFU). The mean and individual results of three independent experiments are shown, with the p values of an ANOVA and Tukey’s multiple comparison test.
Figure 2. Effect of oxygen concentration on the DNA crosslinking activity of a pks+ E. coli. (a) Linearized plasmid DNA was exposed 40 min to the pks+ E. coli strain SP15 grown 3.5 hours with shaking in vented cap tubes within an incubator regulated at the given percentage of oxygen, and then analyzed by denaturing gel electrophoresis. The sizes of the DNA fragments in the ladder are noted in kilobase. The DNA cross-linked by colibactin with apparent doubling in size compared to the intact denatured DNA is shown with an arrow. (b) The percentage of DNA signal in the upper, crosslinked DNA relative to the total DNA signal in the lane was determined by image analysis. The mean and standard error of three independent experiments are shown, with the p values of an ANOVA and Tukey’s multiple comparison test. (c) In the same experiments, the bacterial growth following 3.5 hours culture at given percentages of oxygen was examined by plating and counting colony forming units (CFU).
Figure 3. Effect of oxygen concentration on the production of colibactin cleavage product C14-Asn. The E. coli strain SP15 was grown 3.5 hours with shaking in vented tubes in an incubator regulated at various percentage of oxygen, then the culture supernatants were collected, the lipids were extracted and colibactin cleavage product C14-Asn was quantified by liquid chromatography coupled to mass spectrometry. The mean and standard error of three independent cultures are shown, with the p values of an ANOVA and Tukey’s multiple comparison test. The error bars of the biological triplicate samples at %O2>=13% are too small to appear on the graph.
Figure 4. Effect of oxygen concentration on clbB promoter activity. a. Luminescence of E. coli strain SP15 carrying the luciferase reporter plasmid pCM17 or pMT3 (constitutive promoter or clbB promoter upstream of luxCDABE respectively), or the plasmid without promoter as a control. Three independent bacterial cultures grown 3.5 h at 0% or 21% oxygen were placed in a 96-well microplate and photographed with a CCD camera in a dark imaging station. Atmospheric oxygen present during the image acquisition provide the oxygen required to the reaction catalyzed by the luciferase. b. The luminescence (normalized to the optical density at 600 nm) was measured in a plate reader following 3.5 hours culture at specified percentages of oxygen. The mean and standard error of three independent cultures are shown, with the p values of an ANOVA and Tukey’s multiple comparison test.
Figure 5. Effect of oxygen concentration on clbB gene expression. The mRNA levels of clbB gene were determined in E. coli SP15 grown 3.5 h at specified percentages of oxygen. The DNA copy number of the clbB mRNA relative to that of the cysG housekeeping gene was normalized to the mean maximum level. The mean and standard error of three independent cultures are shown, with the p values of an ANOVA and Tukey’s multiple comparison test. The error bars of the biological triplicate samples at O2>=4% are too small to appear on the graph.
Figure 6. Deletion of arcA results in decreased DNA crosslinking activity of a pks+ E. coli. (a) E. coli wild-type strain SP15, arcA mutant and arcA mutant complemented with a plasmid-encoded arcA were grown 3.5 hours at 0.1% oxygen, then incubated 40 min with linearized plasmid DNA. The DNA cross-linked by colibactin with apparent doubling in size (arrow) was visualized by denaturing gel electrophoresis. The sizes of the DNA fragments in the ladder are depicted in . (b) The percentage of DNA signal in the crosslinked DNA band relative to the total DNA signal in the lane was determined by image analysis. The results of four independent cultures are shown, with the p values of an ANOVA and Tukey’s multiple comparison test. (c). In the same experiments, the bacterial growth following 3.5 hours culture was examined by plating and counting colony forming units (CFU).
Figure 7. Effect of arcA mutation on clbB promoter activity and clbB expression. (a) Luminescence of the E. coli wild-type strain SP15, the arcA mutant, clbP mutant or clbP arcA double mutant carrying the luciferase reporter plasmid pMT3 (encoding the promoter region of clbB upstream of luxCDABE) grown 3.5 h at 0.1% O2. The luminescence (normalized to the optical density at 600 nm) of four independent bacterial cultures grown 3.5 h at 0.1% O2 was measured in a plate reader. The mean and individual values are shown, with the p values of an ANOVA and Tukey’s multiple comparison test. (b) The mRNA levels of the clbB gene were determined in E. coli wild-type strain SP15, the arcA mutant, the complemented arcA mutant (arcA + arcA), the clbP mutant or clbP arcA double mutant grown 3.5 h at 0.1% O2. The DNA copy number of the clbB mRNA relative to that of the cysG housekeeping gene was normalized to the mean wild-type level. The mean and individual values of independent cultures are shown, with the p values of an ANOVA and Tukey’s multiple comparison test.
Figure 8. Phosphorylated ArcA binds to clbB promoter region. EMSA using a DNA probe carrying the clbB promoter region and purified ArcA-P (phosphorylated in vitro) or ArcA, in indicated amounts. DNA probes carrying a cysG intragenic region or mdh promoter region were used as negative and positive controls, respectively.
Figure 9. Oxygen and the arcA mutation inhibit the genotoxicity of colibactin-producing E. coli. (a) HeLa epithelial cells were infected with E. coli wild-type strain SP15, the clbP mutant, the arcA mutant, the arcA mutant complemented with plasmid-encoded arcA, or the clbP arcA double mutant for 4 hunder 21% or 4% oxygen atmosphere, and then cellular DNA-damage was detected by γH2AX immunofluorescent staining. DNA was counterstained with DAPI. Scale bar = 20 µm. (b) γH2AX mean fluorescence intensity (MFI) within approximately 40 to 90 cell nuclei in 2 to 4 independent experiments was measured by image analysis. The violin plots show the frequency distribution of the data, with the median and quartiles as solid and dotted lines. P values were calculated with an ANOVA and Tukey’s multiple comparison test.
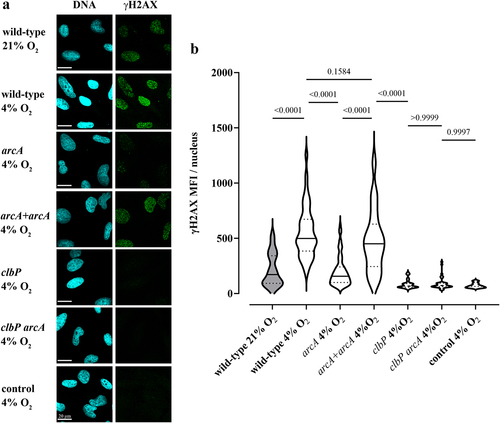
Table 1. Strains, plasmids and primers used in this study.
Supplemental Material
Download MS Word (1.4 MB)Data availability statement
The authors confirm that the data supporting the findings of this study are available online : https://dataverse.harvard.edu/dataset.xhtml?persistentId=doi%3A10.7910%2FDVN%2FXVRZ4C.