Figures & data
Figure 1. Growth curves of HGM grown on cello-oligosaccharides were detected.
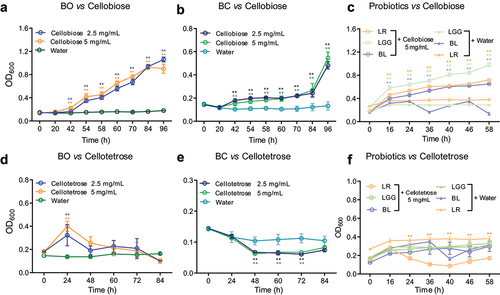
Figure 2. The degradation products of cellobiose were analyzed by TLC.
Figure 3. Polysaccharide utilization loci (PULs) were screened by RNA-seq and confirmed by RT-qPCR.
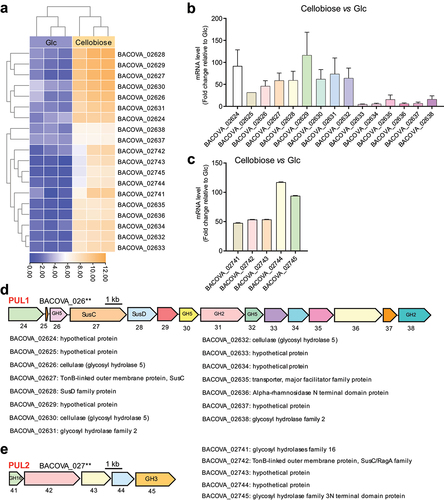
Figure 4. Two new cellulases were determined.
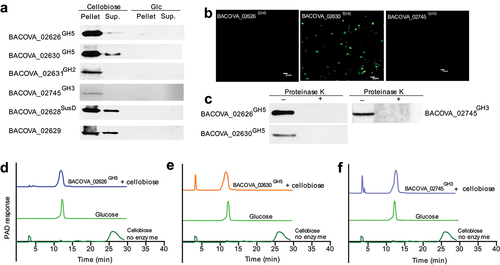
Figure 5. Structure biology of BACOVA_02626GH5 and BACOVA_02630GH5.
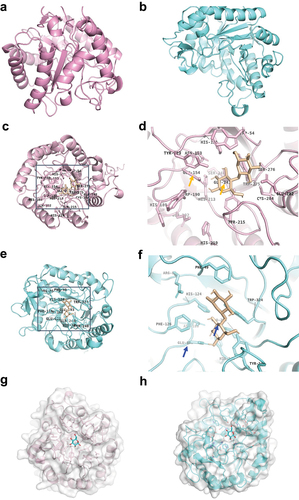
Figure 6. Function of cellobiose on the composition of gut microbiota was analyzed by diversity sequencing based on 16S rRNA.
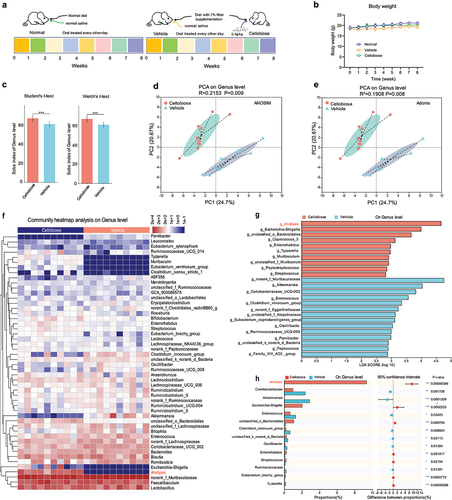
Figure 7. Predication of metabolic function of bacteria and inflammatory factors detection.
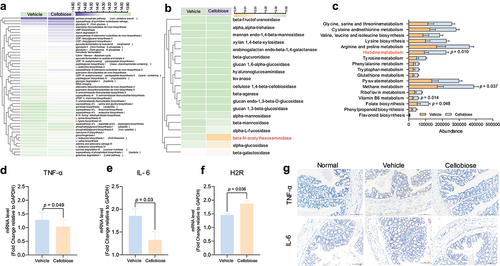
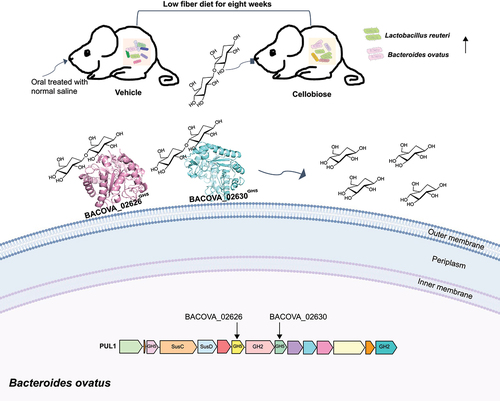
Figure 8. Model of degradation of cellobiose by human gut BO. Two new cellulases on the cell surface conferred the degradation of cellobiose into glucose were determined. In vivo test, we observed that cellobiose reshaped the composition of gut microbiota, and the abundance of LR and BO were enriched significantly after eight weeks administration by gavage.