
Figures & data
Figure 1. Experimental design.
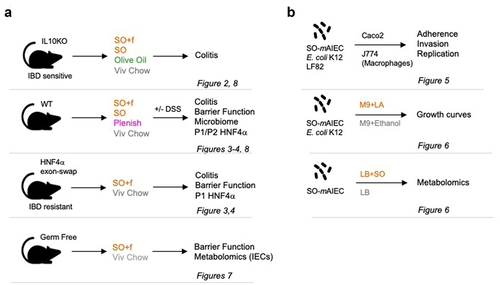
Figure 2. A diet high in LA increases susceptibility to colitis in IL10−/− mice. IL10−/− mice fed SO+f or Viv diet for 10 weeks.
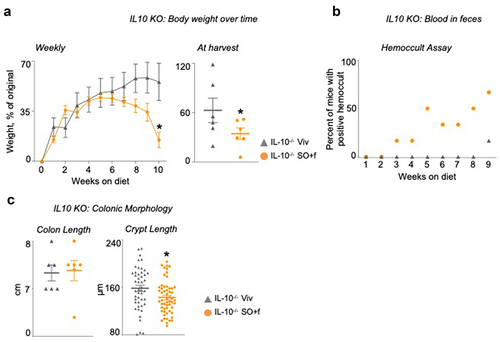
Figure 3. A diet high in LA increases colitis susceptibility and decreases barrier function in WT and α1HMZ mice.
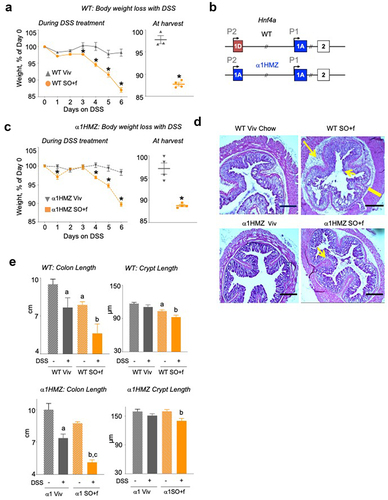
Figure 4. A diet high in LA increases immune dysfunction and decreases barrier function in WT and α1HMZ mice.
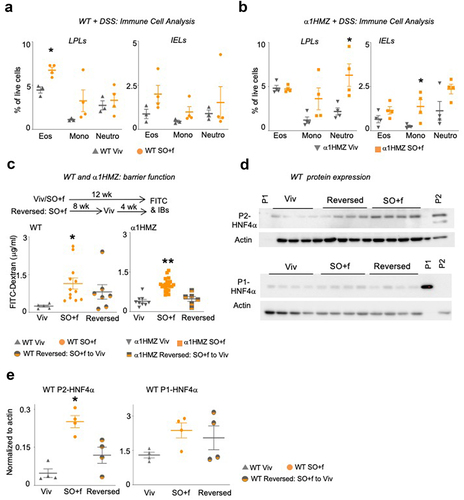
Figure 5. A diet high in LA increases the abundance of SO-mAIEC in WT mouse intestines.
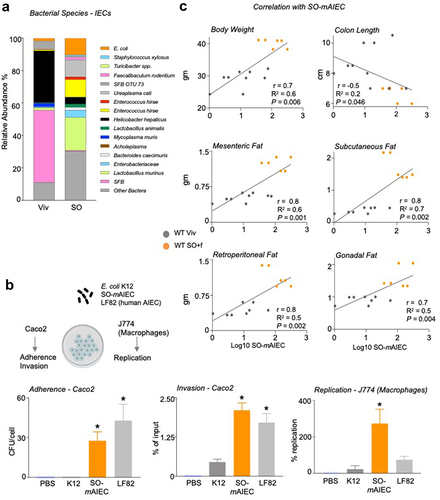
Figure 6. Soybean oil increases oxylipins and decreases endocannabinoid system metabolites in SO-mAIEC cultured in vitro.
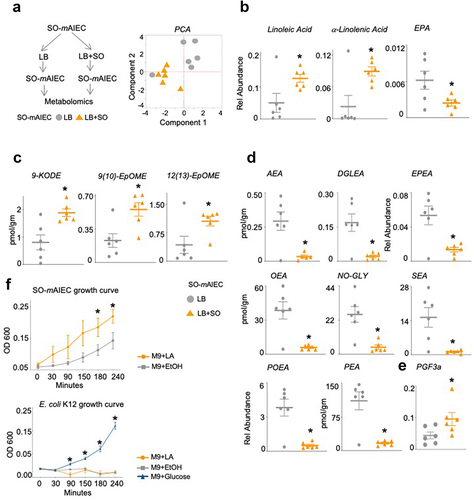
Figure 7. A diet high in LA decreases barrier function and alters the metabolome in the intestines of conventionally raised and germ-free mice.
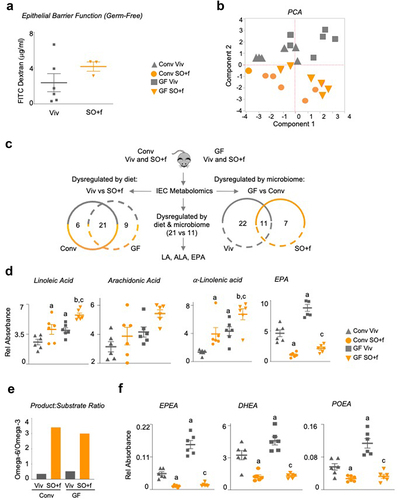
Figure 8. Impact of LA on gut microbiome.
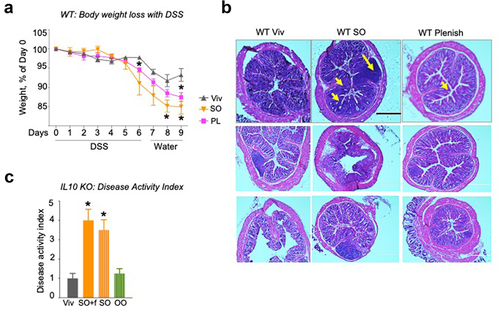
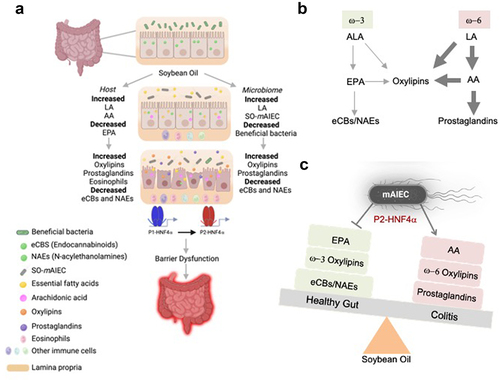
Figure 9. Proposed model by which a soybean oil-based HFD increases susceptibility to colitis.
Supplemental Material
Download Zip (2.1 MB)Data availability statement
The bacterial rRNA ITS sequences have been deposited in the National Center for Biotechnology Information (NCBI)’s Sequence Read Archive (SRA) under the SRA BioProject Accession PRJNA622821 (https://www.ncbi.nlm.nih.gov/bioproject/PRJNA622821/). The metabolomics data supporting the findings of this study are available within the article and the supplementary materials.