
Figures & data
Figure 1. Fucose administration promotes intestinal epithelial differentiation in vivo. (a) HE staining of ileum sections from control and fucose-treated mice and statistical analysis of villi height and crypts depth (Scale bar, 100 μm). (b) PAS staining of sections of ileum tissues from control and fucose-treated mice and statistical analysis of number of goblet cells and Paneth cells (Scale bar, 100 μm). (c) if analysis of lysozyme, Muc2 and ChgA on ileum sections from control and fucose-treated mice (Scale bar, 100 μm). (d) Relative gene expression of Lyz1, Muc2 and ChgA in ileum tissues of control and fucose-treated mice. (e) Relative gene expression of Dll1, Math1, Spdef, Rfx6, Sox4, and Tox3 in ileum tissues of control and fucose-treated mice.
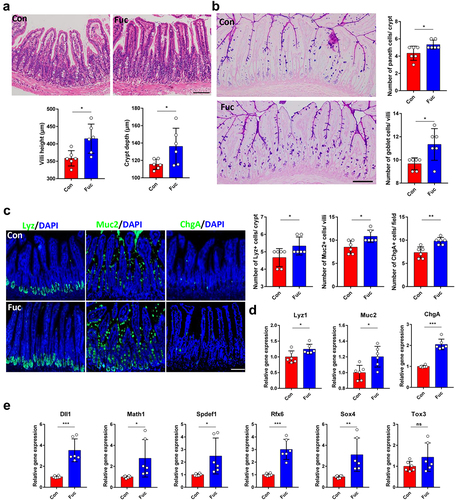
Figure 2. Fucose administration increases Lgr5+ ISCs and promote ISCs proliferation. (a) if analysis of Lgr5-EGFP on ileum sections from control and fucose-treated mice (Scale bar, 100 μm). (b) IHC analysis of Olfm4 on ileum sections from control and fucose-treated mice (Scale bar, 100 μm). (c) Western blot analysis of Lgr5 and Olfm4 in ileum crypts of control and fucose-treated mice. (d) Relative gene expression of Lgr5, Olfm4 and Ascl2 in ileum crypts of control and fucose-treated mice. (e) if analysis of Lgr5-EGFP and Ki67 in ileum crypts of control and fucose-treated mice (Scale bar, 50 μm). (f) EdU staining on ileum sections from control and fucose-treated mice at different timing (Scale bar, 100 μm). (g) Images of organoids derived from control and fucose-treated mice and statistical analysis of surface area and budding number (Scale bar, 50 μm).
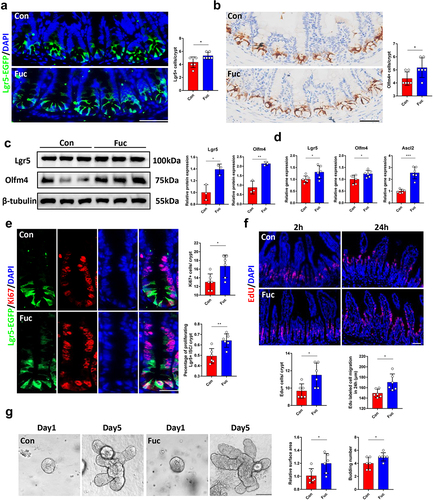
Figure 3. Gut microbe participates in the effects of fucose on ISCs. (a) HE staining of ileum sections from control and fucose-treated mice with or without antibiotic treatment (Scale bar, 100 μm). (b) Relative gene expression of Lyz1, Muc2 and ChgA in ileum crypts of control and fucose-treated mice with or without antibiotic treatment. (c) Relative gene expression of Lgr5, Olfm4 and Ascl2 in ileum crypts of control and fucose-treated mice with or without antibiotic treatment. (d,e) if analysis of Lgr5-EGFP and Ki67 in ileum crypts of control and fucose-treated mice with or without antibiotic treatment and statistical analysis of proliferation cells (Scale bar, 50 μm). (f,g) if analysis of Lgr5-EGFP and Ki67 in ileum crypts of control and fucose-treated mice with or without antibiotic treatment and statistical analysis of Lgr5+ cells and Lyz+ cells.
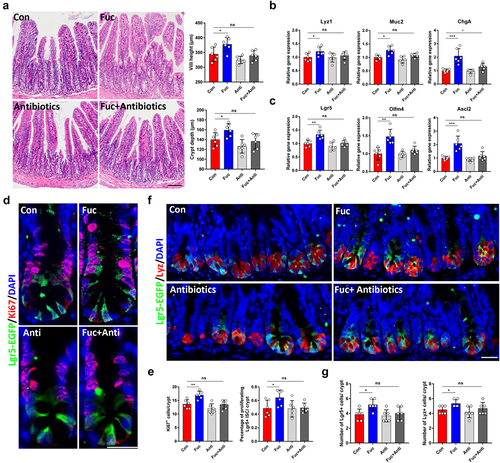
Figure 4. Fucose administration alters gut microbiota composition, increases abundance of Akkermansia and facilitates propanoate metabolism. (a) Alpha diversity analysis of gut bacteria from control and fucose-treated mice. (b) Beta diversity analysis of gut bacteria from control and fucose-treated mice. (c) Relative abundance of bacteria on the level of phylum, family and genus. (d,e) LEfSe analysis (LDA score and cladogram) of gut bacteria from control and fucose-treated mice. (f) KEGG analysis of gut bacteria from control and fucose-treated mice. (g) Relative abundance of Akkermansia and propionic acid in ileum contents and correlation analysis of them.
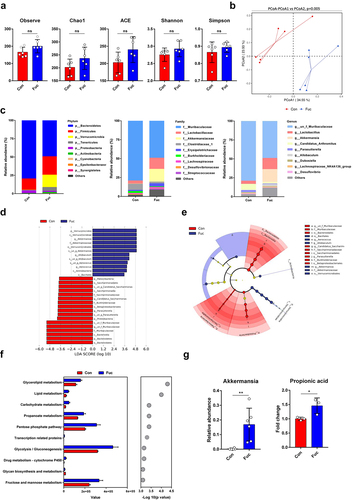
Figure 5. Propionic acid and propionate promote organoid formation and ISCs proliferation. (a) Images of organoids that were treated with propionic acid or propionate (Scale bar, 50 μm). (b) if analysis of Lgr5-EGFP in organoids that were treated with propionic acid or propionate (Scale bar, 50 μm). (c) Relative gene expression of Lgr5, Olfm4, and Ascl2 of organoids that were treated with propionic acid or propionate. (d) EdU and Ki67 staining of organoids that were treated with propionic acid or propionate. (e) Relative gene expression of Lyz1, Muc2, and ChgA of organoids that were treated with propionic acid or propionate.
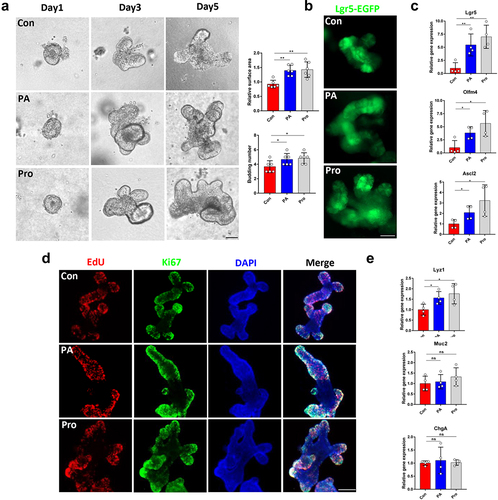
Figure 6. Fucose enhanced the property of Akk to promote ISCs stemness via increasing its propionic acid production. (a) Images of organoids that were treated with supernatant of Akk or fucose-treated Akk and EdU staining (Scale bar, 50 μm). Akk+Fuc1: Akk was pretreated with 1 mM fucose, Fuc5: Akk was pretreated with 5 mM fucose. (b) Relative gene expression of Lgr5, Olfm4, Ascl2 Lyz1, Muc2 and ChgA of organoids that were treated with supernatant of Akk or fucose-treated Akk. (c,d) the concentration of SCFAs in the supernatant of Akk and 5 mM fucose-treated Akk.
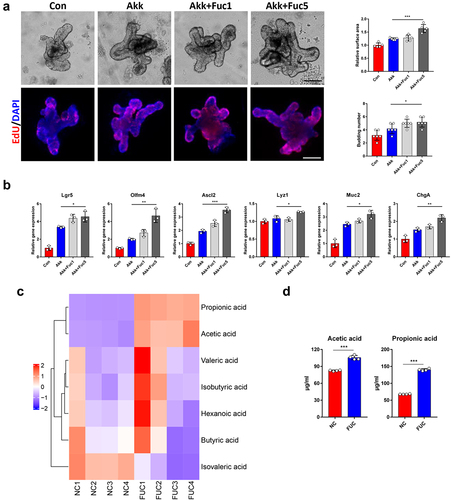
Figure 7. Ileal contents from fucose administrated mice promotes organoids development in a Gpr41/Gpr43 dependent manner. (a) Images of organoids that were treated with ileal contents from control and fucose-treated mice and statistical analysis of surface area and budding number (Scale bar, 50 μm). (b) if analysis of Lgr5-EGFP in organoids that were treated with ileal contents from control or fucose-treated mice (Scale bar, 50 μm). (c) Relative gene expression of Lgr5, Olfm4 and Ascl2 of organoids that were treated with ileal contents from control or fucose-treated mice. (d) EdU and Ki67 staining of organoids that were treated with ileal contents from control or fucose-treated mice (Scale bar, 50 μm). (e) if analysis of lysozyme, Muc2 and ChgA on organoids that were treated with ileal contents from control or fucose-treated mice (Scale bar, 50 μm). (f) Relative gene expression of Lyz1, Muc2 and ChgA of organoids that were treated with ileal contents from control or fucose-treated mice. (g) Images of organoids that were treated with ileal contents from control and fucose-treated mice when there were Gpr41/Gpr43 antagonist (Scale bar, 50 μm). (h) EdU staining on organoids that treated with ileal contents from control and fucose-treated mice when there was Wnt-c59 (Scale bar, 50 μm).
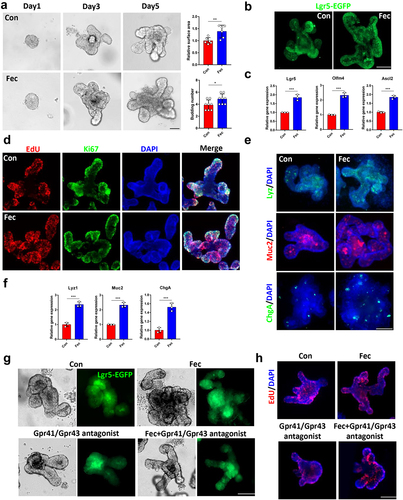
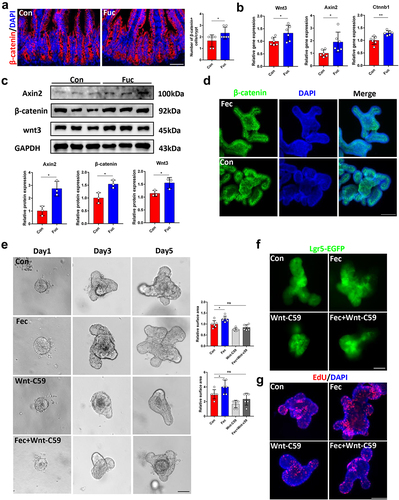
Figure 8. Fucose administration promotes ISCs functions through Wnt signaling pathway. (a) if analysis of β-catenin in ileum crypts of control and fucose-treated mice (Scale bar, 100 μm). (b) Relative gene expression of Wnt3, Axin2 and Ctnnb1 in ileum crypts of control and fucose-treated mice. (c) Western blot analysis of Wnt3, Axin2 and β-catenin in ileum crypts of control and fucose-treated mice. (d) if analysis of β-catenin in organoids that were treated with ileal contents from control or fucose-treated mice. (e) Images of organoids that were treated with ileal contents from control and fucose-treated mice when there were Wnt signaling inhibitor Wnt-c59 (Scale bar, 50 μm). (f,g) Lgr5-EGFP and EdU staining of organoids that were treated with ileal contents from control and fucose-treated mice when there were Wnt signaling inhibitor Wnt-c59 (Scale bar, 50 μm).
Supplemental Material
Download MS Word (12.4 MB)Data availability statement
The datasets used and analyzed during the current study are available in Science Data Bank (ScienceDB, https://www.scidb.cn/, DOI: 0.57760/sciencedb.07487) upon reasonable request.