Figures & data
Figure 1. (a) Donor-recipient matching and prognostic information for the cohort. Acronyms stands for the donor code. Seven individuals highlighted with a red background displayed ineffective responses to FMT treatment. Another sixteen patients denoted with a blue background experienced alleviation of symptoms following FMT intervention. The gender annotations of both patients and donors were accurately aligned with real-world cases. (b) Enterotype distribution in the donor group and rCDI patient group before receiving FMT therapy. The ordinate indicates the percentage distribution of certain enterotype individuals in each group. (c) Treatment response and enterotype switching outcomes for each rCDI patient after FMT treatment.
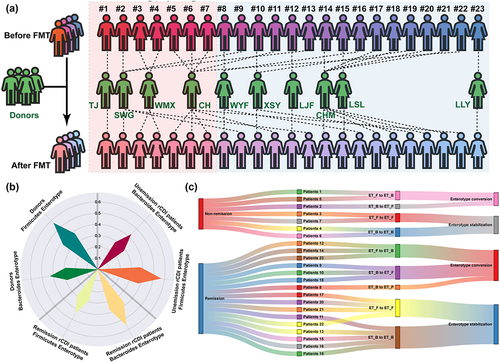
Table 1. Characteristics of patients in remission group and non-remission group.
Figure 2. PCoA plot based on Bray-Curtis dissimilarity matrices of (A) FMT outcome and (b) enterotype. Marginal densities were used to show the separation of microbiome data. α-diversity indices, including (c) Shannon index, (d) Gini-Simpson index, (e) ACE index, and (f) Chao 1 index, show that rCDI patients in the FMT-ineffective group had lower bacterial diversity. The p value was obtained by ANOVA design.
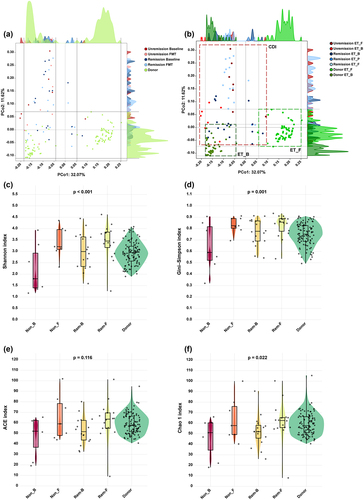
Figure 3. The composition of bacterial (a) phyla and (b) genera in the donor group and rCDI patient group before and after receiving FMT treatment. *Indicates a significant difference compared with the donor group (p < 0.05), and the p value was obtained by ANOVA design. (c) LEfSe cladogram presented the characteristic microbes of donors and patients with or without FMT response. (d) Heatmap showed the colonization antagonism of characteristic microbes. The relative abundance of (e) Burkholderiales_unclassified, (f) Coprococcus_2, and (g) Oscillospira in rCDI patients and their donors. (h) Five patients received enterobacteria transplantation from donor CH.
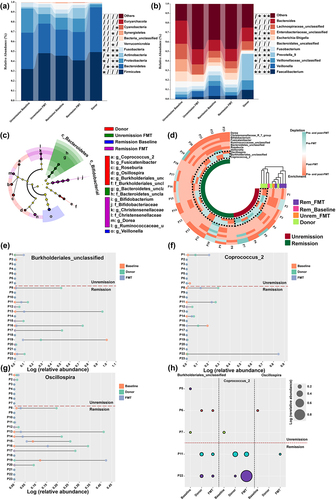
Figure 4. (a) Shannon index, (b) Gini-Simpson index, (c) ACE index, and (d) Chao 1 index for samples from 4 donors. Donor CH and SWG had low average FMT effectiveness levels, and XSY and CHM had high average FMT effectiveness levels. The p value was obtained by ANOVA design.
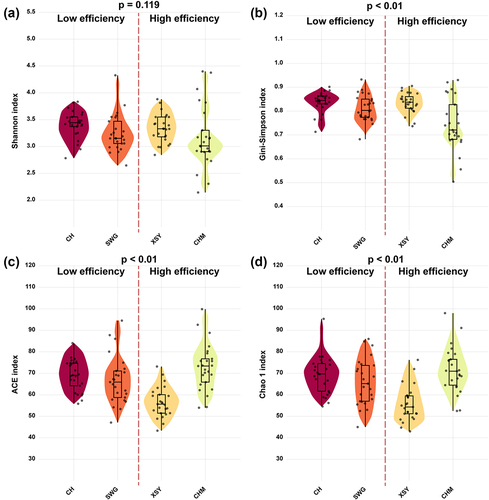
Figure 5. The relative abundance of (a) Bifidobacterium, (b) Christensenellaceae_r_7_group, (c) Dorea, (d) Ruminococcaceae_unclassified, (e) Bacteroidetes_unclassified, (f) Veillonella, (G) Burkholderiales_unclassified, (h) Coprococcus_2, (I) Fusicatenibacter, (j) Oscillospira, and (k) Roseburia from the four donors. The p value was obtained by ANOVA design.
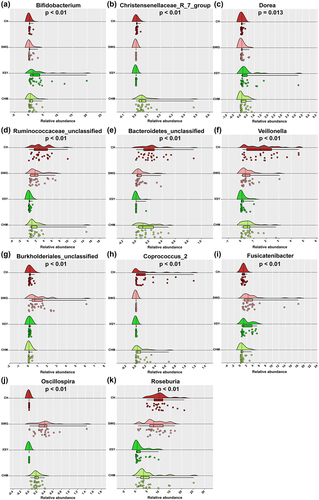
Figure 6. The relative abundance fluctuation of (a) Burkholderiales_unclassified, (b) Coprococcus_2, (c) Oscillospira for the four donors. The presence or absence of (d) Burkholderiales_unclassified, (e) Coprococcus_2, and (f) Oscillospira in the four donors. Co-occurrence network of microbes in (g) rCDI patients with poor FMT prognosis, (h) low-effectiveness FMT donors, (i) rCDI patients with good FMT prognosis, and (j) high-effectiveness FMT donors. (k) Spearman correlation between the relative abundance of 11 characteristic genera in rCDI patients before and after treatment and the clinical factors of the patients. * indicates p-value <0.05. ** indicates p-value <0.01.
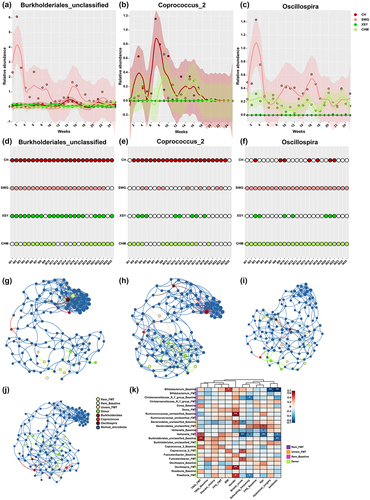
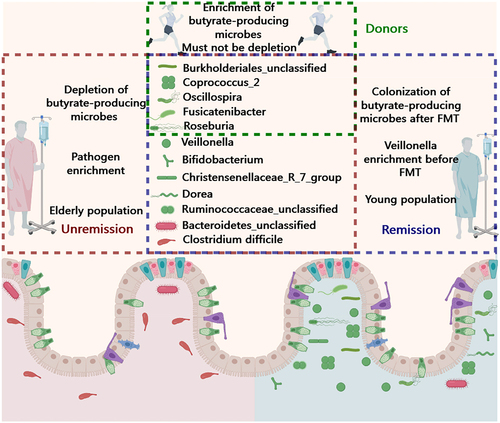
Figure 7. Microbiota characteristics of donor and recipient associated with FMT therapy prognosis in rCDI patients. The group of genera marked in green encompass butyrate-producing bacteria and their commensal microbes. Conversely, the genera highlighted in red include pathogenic bacteria and their associated commensal microbes. Except for Bacteroidetes_unclassified and Burkholderiales_unclassified, all genera belong to Firmicutes.