
Figures & data
Figure 1. Fiber treatments inhibited the increase of blood pressure, target organ hypertrophy but not disease activity in systemic lupus erythematosus (SLE) mice.
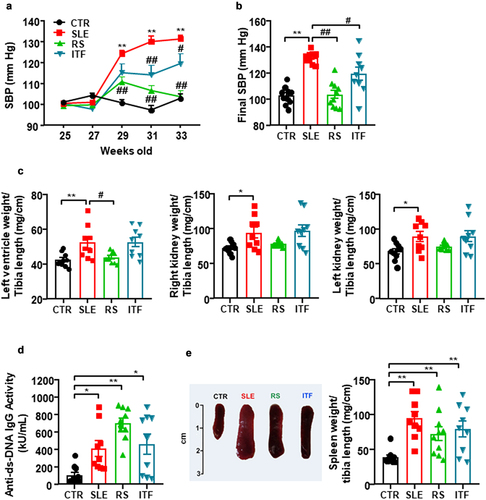
Figure 2. Fiber treatments improved morphological renal cortex features in systemic lupus erythematosus (SLE) mice.
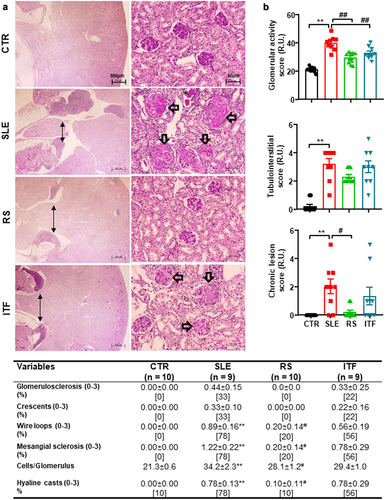
Figure 3. Fiber treatments changed short chain fatty acids (SCFAs) bioavailability in systemic lupus erythematosus (SLE) mice.
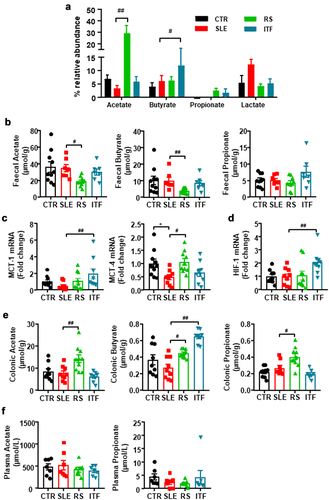
Figure 4. Effects of fiber treatments on lymphocytes populations in systemic lupus erythematosus (SLE) mice.
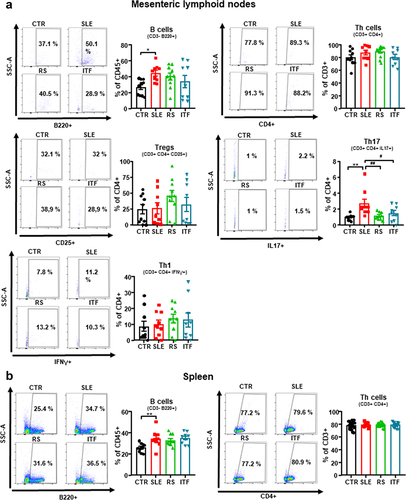
Figure 5. Fiber treatments improved endothelial function, NADPH oxidase activity and aortic infiltration of immune cells in systemic lupus erythematosus (SLE) mice.
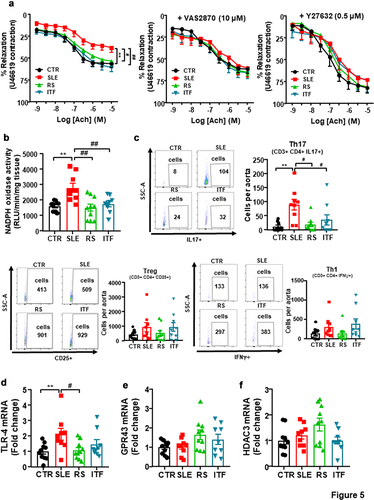
Figure 6. Fiber treatments prevented the transfer of hypertensive phenotype to germ-free mice induced by inoculation of feces from systemic lupus erythematosus (SLE) mice.
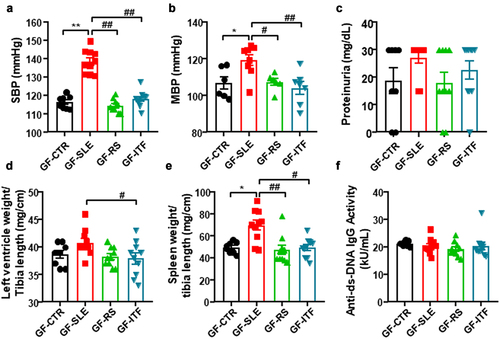
Figure 7. Fiber treatments prevented the transfer of endothelial dysfunction phenotype to germ-free mice induced by inoculation of feces from systemic lupus erythematosus (SLE) mice.
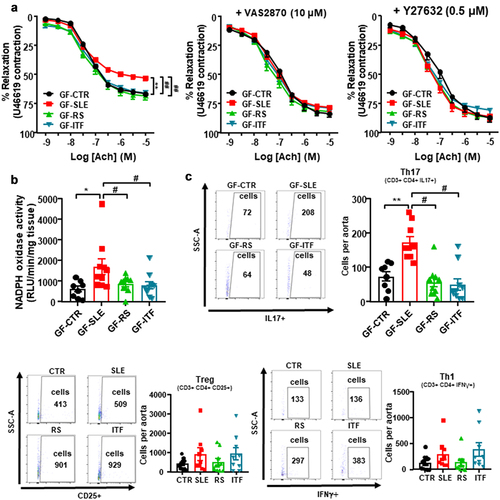
Table 1. Oligonucleotides for real-time RT-PCR.
Table 2. Key antibodies for flow cytometry.
Supplemental Material
Download MS Word (4.1 MB)Data availability statement
The sequencing dataset from this study have been deposited in ZENODO (Doi: 10.5281/zenodo.7547433).