
Figures & data
Figure 1. MNoV_S99 aggravates inflammation in DSS-induced colitis. a)- in vivo experimental design, C57BL/6J mice were orally gavaged with PBS (200 µL) or MNoV_S99 (5×10⁷ TCID50/mL), 7 d later, all the mice were given DSS in drinking water for a week. Mice were weighed daily for weight loss comparison. b)- 3% DSS-induced colitis ± MNoV_S99 (n = 6). c)- 5% DSS-induced colitis ± MNoV_S99 (n = 6). In b) and c), statistical differences were determined by two-way ANOVA test, *p < 0.05, **p < 0.01, ***p < 0.001. d)- Representative images from H&E staining of colon sections from mock-treated (control) or 3% DSS ± MNoV_S99 treated mice. Insets showing higher magnifications from each image are presented next to each image. e)- muscle wall thickness was determined with image J from colon section images. Percentages of increase are plotted after baseline subtraction relative to the values obtained from control mice (n = 6). f)- histological intestinal epithelial inflammation scores comparison between control, 3% or 5% DSS ± MNoV_S99 treated mice (n = 6). g)- colon length comparison between control and 5% DSS ± MNoV_S99 treated mice h)- IL6 secretion levels from colon explants from mock or 5% DSS ± MNoV_S99 treated mice (n = 6). Statistical differences were determined with Student’s t-test in E, F, G and H.
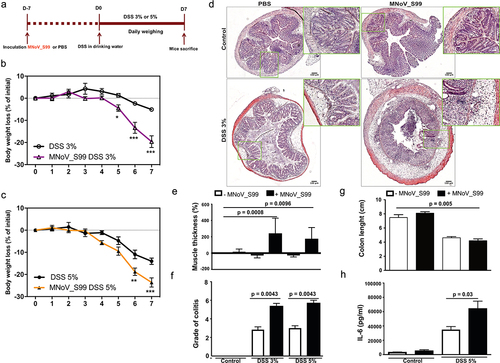
Figure 2. MNoV_S99-associated inflammation is NOD2 dependent weight loss comparison in a)- 3% DSS-induced colitis ± MNoV_S99 in WT mice (n = 6) and b)- in Nod2-/- mice (n = 6), statistical differences were determined by two-way ANOVA test, *p < 0,05, **p < 0,01, ***p < 0,001. c)- Representative images of H&E staining of colon sections from mice in a) and b). Insets showing higher magnifications are presented below each image. d)- Percentages of increase of muscle wall thickness from colon section images are plotted after baseline subtraction relatively to the values obtained from WT mice treated only with DSS (n = 6), statistical differences were determined with Student’s t-test.
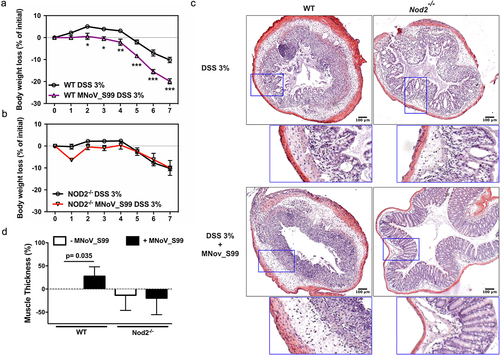
Figure 3. MNoV_S99 associated pro-inflammatory signaling is NOD2 and MAVS-dependent in myeloid lineage cells. a)- Representative image showing an intestinal villus from a Nod2GFP mouse. NOD2-GFP is shown in green, actin is stained with Phalloidin in gray and nuclei were stained with DAPI in blue; scale bare represents 50 µm. b)- Representative western blot showing STAT1 signaling pathway activation after 1 h infection (Moi 1) with the mentioned MNoV strains in BMDM. Below are shown quantification of pSTAT1 bands intensities normalized to β-actin and relative to mock-infected cells (n = 3, mean ± SEM), statistical differences were determined by one-way ANOVA test *p < 0,05, **p < 0,005. c)- STAT1 activation in response to MNoV_S99 (Moi 1 or 5) in BMDM from WT vs Nod2-/- infected for 30 or 60 minu. The lower panel shows quantification of pSTAT1, bands intensities normalized to β- actin and relative to mock-infected cells (n = 3, mean ± SEM). Statistical differences were determined by two-way ANOVA test *p < 0,05. d)- STAT1 activation in response to MNoV_S99 (Moi 0.1) in WT or Nod2-/- BMDM infected for 24 h. Relative quantification of pSTAT1 (n = 3, mean ± SEM) is shown in the lower panel, statistical differences were determined by two-way ANOVA test ***p < 0,0005. e)- STAT1 activation in response to MNoV_S99 (Moi 0.1) in BMDM from WT vs Mavs-/- infected for 60 min. Relative quantification of pSTAT1 (n = 4, mean ± SEM) are shown below. Statistical differences were determined by two-way ANOVA test *p < 0,05.
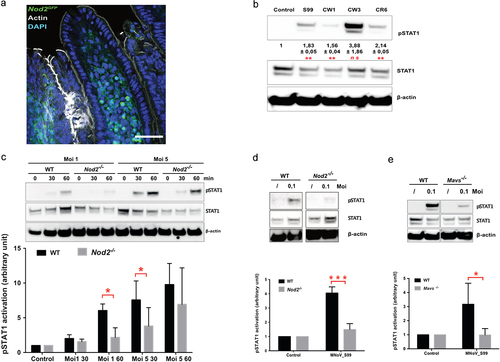
Figure 4. NOD2-dependent noroviral load. a)- WT, Nod2-/- and Atg16l1HM mice (n = 5 each) were treated with 3% DSS and infected with MNoV_CR6 (3×10⁷ PFU). Inflammation was measured as percentage of increase in muscle thickness at the anal-rectal junction in colonic section images plotted after baseline subtraction relatively to the values obtained from WT mice. b)- the viral load measured in stools from WT, Nod2-/- and Atg16l1HM mice at days 3, 5, and 7 post-infection with MNoV_CR6 (3×10⁷ PFU) (n = 8). c)- the viral load measured from indicated tissue samples from MNoV_CR6 infected (3×10⁷ PFU) WT, Nod2-/- and Atg16l1HM mice that were treated for 1 week with D55 3% (n = 5). d)- MNoV_S99 genome quantification from WT and Nod2−/− BMDM cells infected with MNoV_S99 (Moi 0.1 for 24 h) (n = 3). All the statistical differences were measured with Student’s t-test.
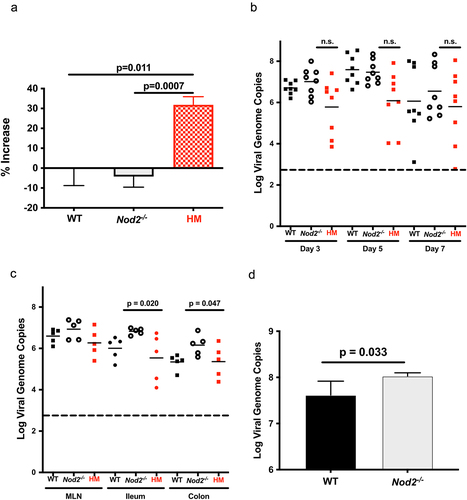
Figure 5. NOD2-dependent pro-inflammatory signaling associated with MNoV_S99 infection and bacterial MDP. Quantification of Nod2 mRNA levels measured by RT-qPCR in a)- in Raw264.7 cells infected with MNoV_S99 (Moi 0.1 or 1, for 24 h) and in b)- in BMDM from WT mice (Moi 0.1, for 24 h) normalized to ActB and relative to mock-infected cells (n = 3). c)- Representative western blot showing STAT1 and IκBα signaling pathways modulation in cell lysates from monocytes that were either infected with MNoV_S99 (Moi 5, 2 h), treated with MDP (10 ng/mL, 2 h), or a combination of both. d)- quantification and comparison of pSTAT1 and pIκbα signals between MNoV_S99 infected alone cells or in combination with MDP (10 ng/mL, 2 h), (n = 3), with the band intensity being normalized to β-ACTIN and relative to mock-treated cells. e) TNFα production by BMDC subjected to MNoV_S99’s ssRNA (10 µg/mL) alone, or supplemented with either MDP (1 µg/mL) or MDP-DD (1 µg/mL) overnight. f) TNFα production by BMDM cells infected with MNoV_S99 (Moi 0.1 or 1) for 6 h, prior to being treated with MDP (10 µg/mL) overnight. g) Net production of MNoV_S99 in Raw264.7 cells infected with MNoV_S99 (Moi 1 for 2 h before MDP treatment (100 ng/mL) for 24 h). Statistical differences were analyzed with Student’s t test.
Table 1. Antibodies used for western blotting.
Supplemental Material
Download PNG Image (518.8 KB)
Supplemental Material
Download PNG Image (124.5 KB)
Supplemental Material
Download MS Word (15.9 KB)Data availability statement
The data that support the findings of this study are available from the corresponding authors, GM and MC, upon request on HAL. https://hal.science/hal-04101382.