
Figures & data
Figure 1. Global lipidomics analysis of Lactobacillus johnsonii N6.2 total lipids (TL). Total lipids from L. johnsonii N6.2 were purified and pooled from a large-scale culture and profiled by qualitative LC-MS/MS analysis. a: Percentage abundances in lipid categories. b: Percentage abundances in lipid classes. The abbreviation GCL for glycerolipids was selected to avoid confusion with GL (denotation used for the glycolipid fraction obtained after lipid fractionation of L. johnsonii N6.2 total lipids).
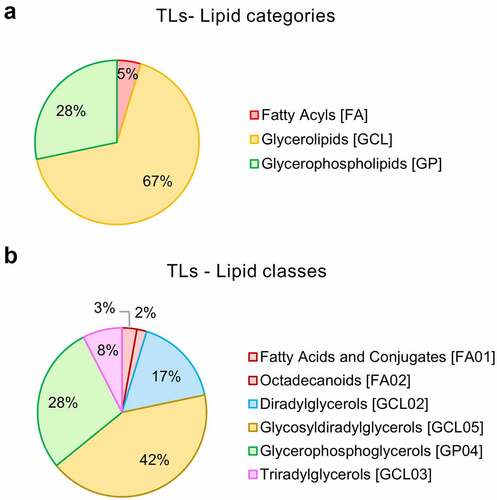
Figure 2. RNAseq-based global evaluation of BMDCs responses to total lipids derived from Lactobacillus johnsonii N6.2. a: Principal component analysis of treatment groups (Lj-N6.2_TL: L. johnsonii N6.2-TL-treated group; a-GalCer: α-GalCer-treated group; and Vehicle_control). b: Heatmap of total significantly differentially expressed genes (DEG) in Lj-N6.2_TL group (p.adjust < 0.01). The data showed a specific expression signature induced by total lipids from L. johnsonii N6.2 on BMDCs. c: Gene ontology enrichment analysis of DEG in L. johnsonii N6.2 treatment with absolute values of log2FC ≥ 1. Data represent three independent assays.
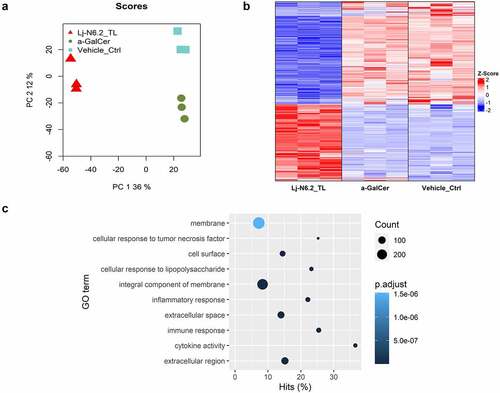
Figure 3. RNAseq-based analysis of BMDCs response to total lipids derived from L. johnsonii N6.2. Heatmap displays selected DEGs with absolute values of log2FC between 1 and 2 and greater than 2 (p.adjust < 0.01). Total lipids (TLs) from L. johnsonii N6.2 significantly upregulate several regulatory molecules involved in the regulation and suppression of immune responses. The graphic displays the results obtained from three independent assays.
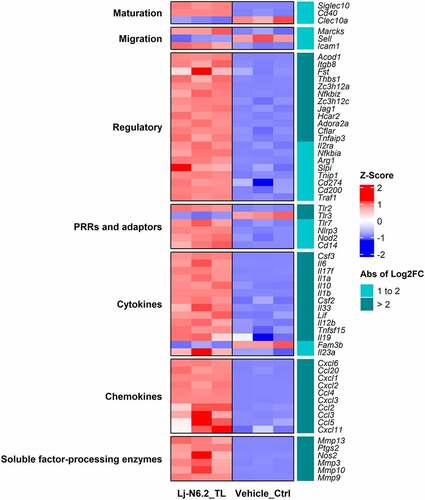
Figure 4. Gene expression of selected response-markers after fractionation of L. johnsonii N6.2 lipids into simple lipids (SL), glycolipids (GL) and phospholipids (PL). BMDCs were stimulated with total lipids (TL) at 500 ng/mL or three different fractions, at 5 µg/mL (SL, GL, and PL) for 6 h. VC: Vehicle control. The graphic displays the results obtained from three independent assays. Different letter labels denote statistically significant changes (p.value < 0.05).
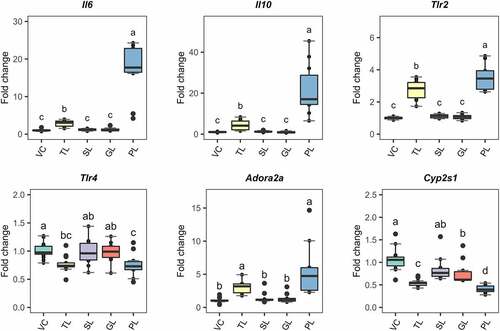
Figure 5. Relative surface expression of maturation and migration markers in BMDCs normalized to vehicle-treated cells and presented as Log2 values. BMDCs were stimulated with total lipids (TLs) at 500 ng/mL or fractions at 5 µg/mL for 6 h. SL: simple lipids, GL: glycolipids, PL: phospholipids. PLs significantly reduce surface expression of CD86 and induce a sig. increase of migration marker ICAM-1. VC: Vehicle control. The graphic displays the results obtained from three independent assays. Different letter labels denote statistically significant changes (p.value < 0.05).
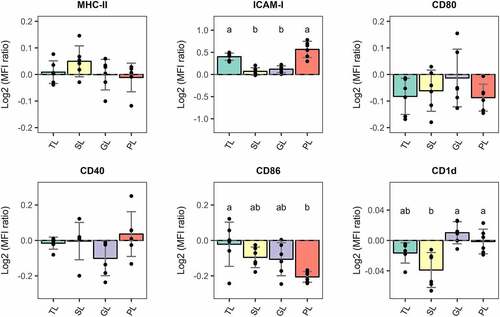
Figure 6. Antibody blocking of TLR2 on the surface of L. johnsonii N6.2 phospholipids-stimulated BMDCs. 7-day BMDCs were Ab-blocked with anti-TLR2 or isotype control Abs at 9 µg/mL for 1 h before addition of L. johnsonii N6.2 PLs at 5 µg/mL and further incubation for 6 h. Negative controls: vehicle control for PLs (Vehicle_ctrl), the Ab storage buffer (Ab_buffer) and both combined (Combined_ctrl). Ab controls: anti-TLR2_Ab and Isotype_Ctrl_Ab. Data was compared to Vehicle_Ctrl for statistical analysis. Data represent the values from three independent assays. Different letter labels denote statistically significant changes (p.value < 0.05).
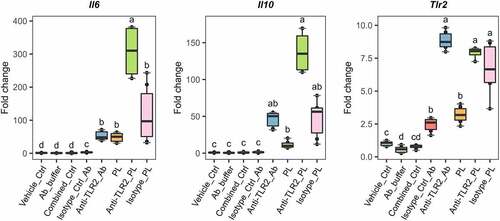
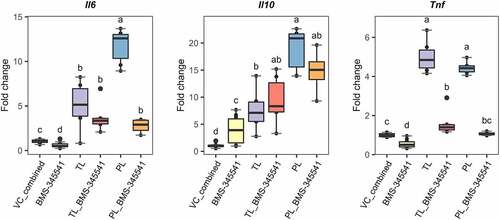
Figure 7. Blocking non-canonical NF-kB signaling in Lactobacillus johnsonii N6.2 lipid-stimulated BMDCs. 7-day BMDCs were pre incubated with the IKKα kinase inhibitor BMS-345541 at 5 µM for 1 h before addition of L. johnsonii N6.2 total lipids (TLs) or phospholipids (PLs) at 0.5 or 5 µg/mL respectively and further incubated for 6 h. Negative controls: vehicle control for L. johnsonii N6.2 lipids mixed with vehicle control for inhibitors (Vc_combined), NF- kB inhibitor alone. Data were obtained from three independent assays. Different letter labels denote statistically significant changes (p.value < 0.05).
Supplemental Material
Download Zip (1.7 MB)Data availability statement
RNAseq data is deposited at the Gene Expression Omnibus (GEO; accession number: GSE221588). Lipidomics data generated in this study is provided in this manuscript as Table S2. Datasets for Table S2 and Table S3 have been uploaded to the Zenodo repository and can be found following the DOIs: 10.5281/zenodo.8044437 and 10.5281/zenodo.8044444, respectively.