
Figures & data
Figure 1. IEC-derived GPR65 preserves intestinal antimicrobial activity. (a-c) qPCR analysis of the indicated genes in IECs from the large bowels of Gpr65fl/fl and Gpr65ΔIEC mice. (d-f) qPCR analysis of the indicated genes in IECs from the small bowels of Gpr65fl/fl and Gpr65ΔIEC mice. (g) representative immunofluorescence staining of REG3γ in both large and small bowels from Gpr65fl/fl and Gpr65ΔIEC mice. Scale bars, 100 μm. (h, i) immunoblotting analysis and quantification of REG3γ in the IECs from the large bowels of Gpr65fl/fl and Gpr65ΔIEC mice. (j, k) information for cellular localization and relative expression level of GPR65 retrieved from publicly available data. *p < 0.05, **p < 0.01. Data are representative of three independent experiments.
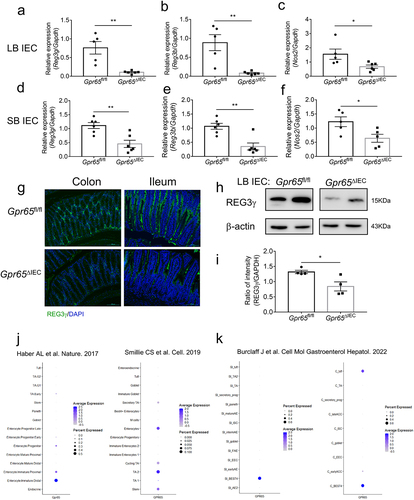
Figure 2. Gpr65ΔIEC mice appear dysbiosis of fecal microbiota. (a-c) operational taxonomic unit (OTU) abundances (a), Shannon diversity index (b), and Principal coordinates analysis (PCoA) (ANOSIM analysis, p = 0.007) (c) of the fecal microbiota isolated from Gpr65fl/fl (n = 5) and Gpr65ΔIEC (n = 4) mice by 16S rRNA sequencing. Each dot represents a mouse. (d) heatmap analysis of the relative abundance of fecal microbiota at the genus level. (e) LEfSe analysis. (f-i) relative abundance of Bacteroides, Parabacteroides, Faecalibaculum and Akkermansia. *p < 0.05.
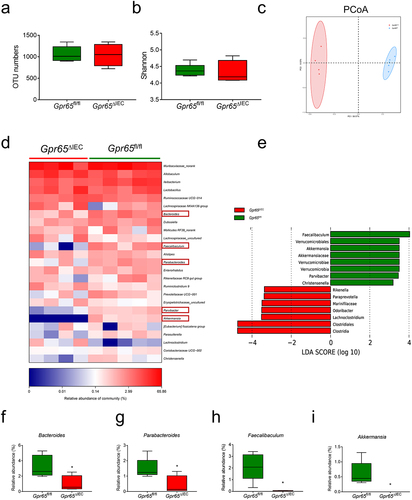
Figure 3. Mice deficient for epithelial GPR65 are prone to DSS-induced colitis. Gpr65ΔIEC mice and Gpr65fl/fl littermates (n = 6 in each group) were administered 2% DSS in drinking water for 7 days, followed by 3 days of regular water. (a) the body weight changes of Gpr65fl/fl and Gpr65ΔIEC mice during DSS-induced colitis. (b) gross morphology of colons on day 10 when mice were sacrificed. (c) colon length on day 10 of the colitis model. (d) representative sections of the distal colon tissues after H&E staining. Scale bars, 100 μm. (e) pathological scores of the colon sections were calculated as indicated. (f) FITC-dextran (μg/mL) in sera. (g-k) relative Il6, Tnfa, Cxcl1, Lcn2 and Il22 mRNA expression in the distal colon tissues of indicated groups of mice. (l-n) relative Reg3g, Reg3b and Nos2 mRNA expression in the colonic IECs of indicated groups of mice. (o-p) immunoblotting analysis and quantification of REG3γ in the colonic IECs. *p < 0.05, **p < 0.01. Data are representative of three independent experiments.
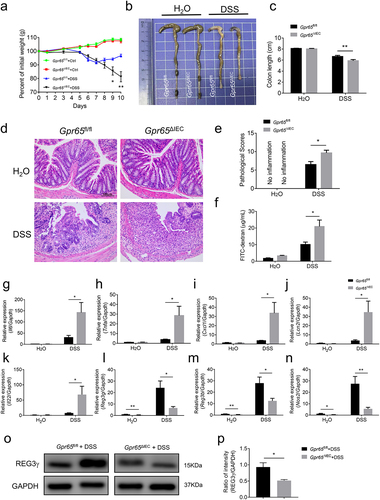
Figure 4. Mice lacking epithelial GPR65 are vulnerable to C. rodentium-induced colitis. Gpr65ΔIEC mice and Gpr65fl/fl littermates (n = 6 in each group) were orally infected with C. rodentium (2 × 10Citation9 CFU/mouse) after fasting for 8 h, and sacrificed at day 8. (a) the body weights of mice were monitored daily. (b, c) gross morphology and colon length in the indicated groups of mice. (d) representative images of the distal colon tissues after H&E staining. Scale bars, 50 μm. (e) pathological scores of the colon sections were calculated as indicated. (f) FITC-dextran (μg/mL) in sera. (g) C. rodentium (Cfu/g) in the liver and feces were measured. (h) qPCR analysis of C. rodentium expression relative to 16S rRNA in the feces. It should be noted here that qPCR measures relative expression between samples, not the actual bacterial numbers or CFUs. (i-k) relative Il6, Tnfa and Cxcl1 mRNA expression in the distal colon tissues of indicated mice. (l-n) relative Reg3g, Reg3b and Nos2 mRNA expression in the colonic IECs of indicated groups of mice. (o-p) immunoblotting analysis and quantification of REG3γ in the colonic IECs. *p < 0.05, **p < 0.01, ***p < 0.001. Data are representative of three independent experiments.
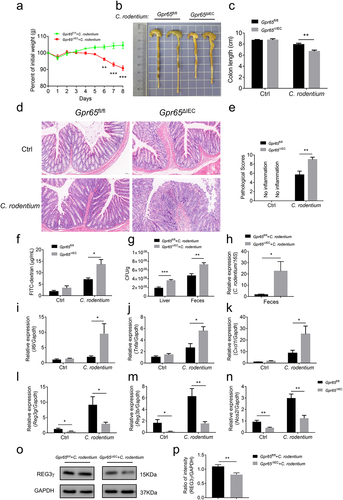
Figure 5. GPR65 deficiency drives distinct IEC transcriptional programs and compromises the downstream STAT3 signaling. colonic IECs were isolated from Gpr65ΔIEC mice and Gpr65fl/fl littermates for RNA sequencing analysis. (a, b) GSEA analysis. (c) Heatmap of DEGs related to IEC antimicrobial gene profiles. (d) a schematic overview of the AMP induction assay by systemic injection with rmIL-17A or rmIL-22. (e, f) qPCR analysis of relative mRNA expression of Reg3g and Reg3b. (g) representative microscopical photographs of colonoids from Gpr65ΔIEC and littermate Gpr65fl/fl mice on day 10 of culture. Original magnification: × 40. (h, i) the colonoids from Gpr65ΔIEC and Gpr65fl/fl mice were stimulated with or without rmIL-22 (100 ng/mL) for 24 h. The relative mRNA expression of Reg3g and Reg3b was detected by qPCR analysis. (j) GSEA analysis for Hallmark_JAK_STAT3_Signaling. (k) STAT3-focused interaction network of genes downregulated by GPR65 signaling. (l) colonic IECs were isolated from Gpr65ΔIEC mice and Gpr65fl/fl littermates, and stimulated with rmIL-22 (100 ng/mL) for 15 min. The protein levels of p-STAT3 and STAT3 were determined by immunoblotting analysis. (m) immunoblotting analysis of p-STAT3 and STAT3 in the colonic IECs from the indicated groups of mice. (n) immunoblotting analysis of p-Erk1/2, Erk1/2, p-mTOR, mTOR, and β-actin in the colonic IECs from the indicated groups of mice. *p < 0.05, **p < 0.01, ***p < 0.001. Data are representative of three independent experiments.
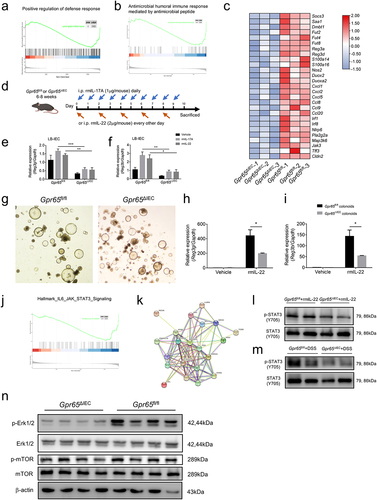
Figure 6. pH sensing role of epithelial GPR65 in regulating AMP expression in vitro. (a) GO cellular component analysis for DEGs. (b) qPCR analysis of relative Reg3g in WT colonoids under the indicated conditions. (c) colonoids isolated from Gpr65ΔIEC and Gpr65fl/fl mice were stimulated with rmIL-22 under the neutral or acidic conditions, and Reg3g mRNA was examined by qPCR analysis. (d, e) HT29 and MC38 cells were transfected with lentivirus expressing GPR65 shRNA (LV-shGPR65), GPR65 (LV-GPR65) and negative control (LV-NC), respectively, and were stimulated with rmIL-22 under the neutral or acidic conditions. The relative mRNA expression of REG3A or Reg3g was examined by qPCR. *p < 0.05, **p < 0.01, ***p < 0.001, ****p < 0.0001. ns, not significant. Data are representative of three independent experiments.
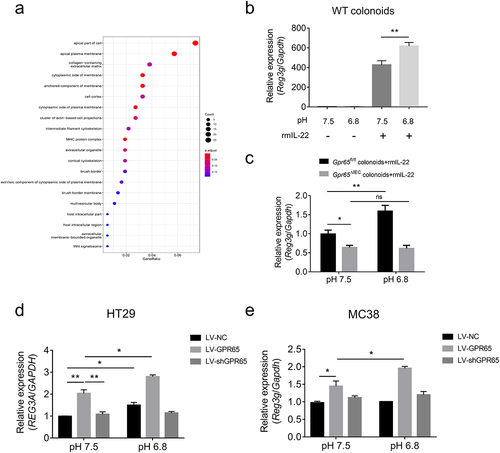
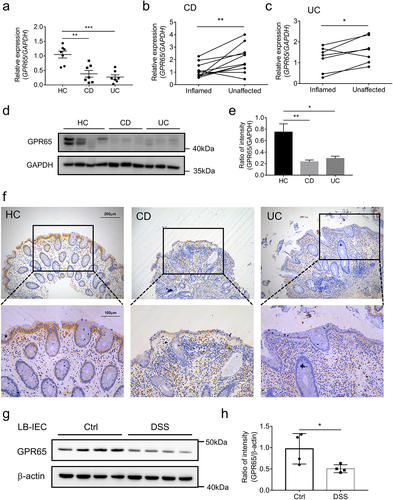
Figure 7. GPR65 is decreased in inflamed mucosa from patients with active IBD and DSS-induced colitis mice. colonic IECs were isolated to extract total RNA and protein. Expression levels of GPR65 were determined by qRT-PCR and Western blot, respectively. (a) relative mRNA expression level of GPR65 in freshly isolated IECs from inflamed sites of patients with CD and UC and relatively normal sites of patients with colon cancer as controls. (b, c) relative mRNA expression levels of GPR65 in paired inflamed and non-affected IECs from patients with CD and UC. (d, e) immunoblotting analysis of GPR65 in inflamed IECs from CD and UC patients and relatively normal IECs from patients with colon cancer. (f) representative sections were obtained from normal colonic mucosa of healthy controls (the left panel) and inflamed colonic mucosa of patients with active CD (the middle panel) or active UC (the right panel), and then stained for GPR65 by immunohistochemistry. Scale bars, 200 μm (inset, 100 μm). (g, h) colonic IECs were isolated from DSS-induced colitis mice and control mice, respectively, and the protein levels of GPR65 were determined by Western blot with β-actin as a reference. *p < 0.05, **p < 0.01, ***p < 0.001. Data are representative of three independent experiments.
Supplemental Material
Download Zip (73.9 MB)Data availability statement
RNA sequencing data from this study are openly available in Gene Expression Omnibus at https://www.ncbi.nlm.nih.gov/bioproject (BioProject No. PRJNA967647). All other data supporting the findings of this study are available within the article and its supplementary materials or from the corresponding author upon reasonable request.