
Figures & data
Figure 1. Representative fucosylated milk oligosaccharides measured in breast milk from mothers in this study. (a) 2’-fucosyllactose (2’FL), (b) lacto-N-fucopentaose I (LNFP I), (c) lactodifucotetraose (LDFT), (d) 3-fucosyllactose (3FL), (e) lacto-N-fucopentaose II (LNFP II), (f) lacto-N-fucopentaose III (LNFP III), (g) the summation of (a)-(f).
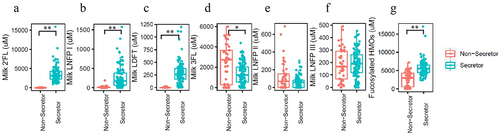
Table 1. Characteristics of mother and infant subjects based on mother’s milk secretor status.
Figure 2. Comparison of fecal microbiome data in infants consuming secretor (cyan) or non-secretor (red) milk. (a) Analysis of beta-diversity using Principal coordinates analysis (PCoA) based on bray distance matrix data. The centroids of each cluster (centroid of mass) were calculated as the average PC1 and PC2 of all samples for each group. The ellipses were constructed based on multivariate normal distribution at 95% confidence level. (b) Analysis of alpha diversity represented as Chao1 and Shannon index. (c) The relative abundance of genera represented at a level of over 1% in the feces of infants consuming secretor milk. (d) The relative abundance of genera represented at a level of over 1% in the feces of infants consuming non-secretor milk.
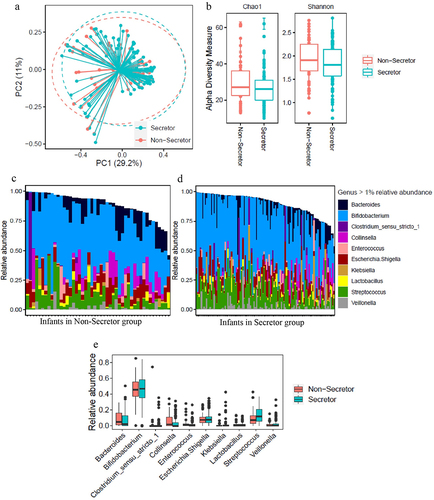
Figure 3. Comparison of infant fecal metabolome data in infants consuming secretor (cyan) or non-secretor (red) milk. (a) Principal coordinate analysis (PCoA) and (b) forest plot illustrating the Cliff’s delta effect size analysis of individual metabolites. Metabolites with a p < .05 determined using the Mann–Whitney U-test with FDR correction are indicated with an asterisk.
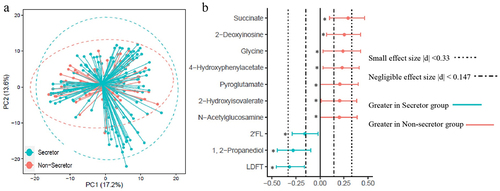
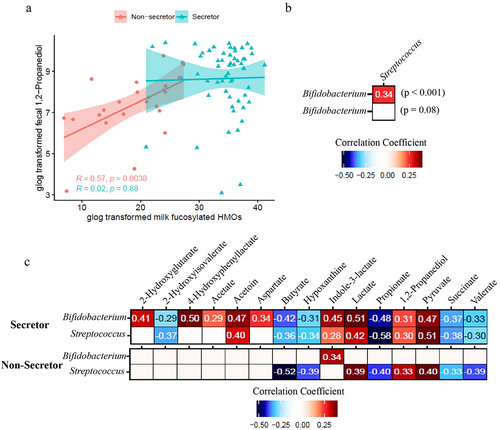
Figure 4. Correlation between the fecal microbiome and fecal metabolome of infants receiving secretor or non-secretor milk. (a) Association between total milk fucosylated HMO concentration in milk from secretor (cyan) and non-secretor (red) mothers and infant fecal 1, 2-propanediol concentrations. (b) Spearman correlation between bacterial taxa in the feces of infants consuming milk from secretor and non-secretor mothers. (c) Spearman correlation between fecal metabolites and the relative abundance of Bifidobacterium and Streptococcus of infants consuming milk from secretor and non-secretor mothers.
Supplemental Material
Download MS Word (466.2 KB)Supplemental Material
Download MS Excel (189.8 KB)Data availability statement
Metabolome data are available as supplementary tables. Squencing data are available at Dryad: https://datadryad.org/stash/share/tMOWGLIvAJo2yx4QrfCyRxexwL6ewSixWF-sNm74soo. ((doi:10.25338/B8V93G))