
Figures & data
Figure 1. Interactions between hydrogenotrophic species. (a) schematic overview of Experiment one. B. hydrogenotrophica, D. piger and M. smithii were cultured in monoculture, or together in binary cocultures and a triculture. (b) hydrogen consumption and metabolite production of B. hydrogenotrophica, D. piger and M. smithii under hydrogenotrophic conditions. (c) log 16S rRNA gene copies per mL of B. hydrogenotrophica, D. piger and M. smithii in monocultures, binary cocultures and a triculture. Data are shown as average ± standard deviation (n = 2). B: B. hydrogenotrophica monoculture; D: D. piger monoculture; M: M. smithii monoculture; BD: B. hydrogenotrophica and D. piger binary coculture; BM: B. hydrogenotrophica and M. smithii binary coculture; DM: D. piger and M. smithii binary coculture; BDM: B. hydrogenotrophica, D. piger and M. smithii triculture.
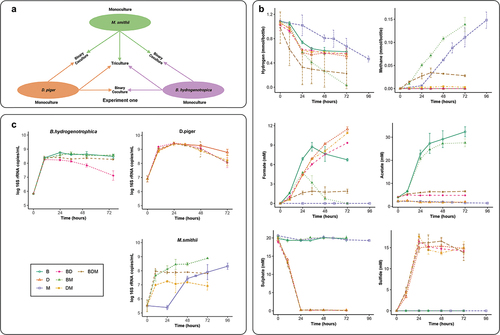
Figure 2. Impact of sulfide concentrations on the growth of B. hydrogenotrophica, D. piger and M. smithii. (a) schematic overview of Experiment two (b) the optimal density of B. hydrogenotrophica, D. piger and M. smithii under different sulfide concentrations during incubations. Data are shown as average ± standard deviation (n = 2).
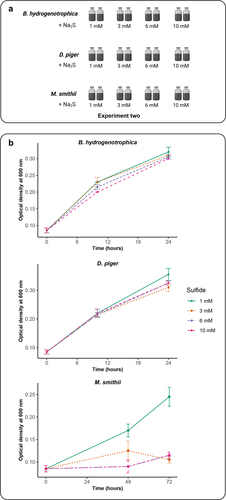
Figure 3. Impact of acetate and formate concentrations on the growth of M. smithii. (a) schematic overview of Experiment three. (b) hydrogen and formate consumption, methane production and microbial density of M. smithii during incubations. Data are shown as average ± standard deviation (n = 2). LANF-H2: 2 mM acetate, 0 mM formate, H2-CO2 headspace; HANF-H2: 20 mM acetate, 0 mM formate, H2-CO2 headspace; LAF-N2: 2 mM acetate, 15 mM formate, N2-CO2 headspace; HAF-N2: 20 mM acetate, 15 mM formate, N2-CO2 headspace; HAF-H2: 20 mM acetate, 15 mM formate, H2-CO2 headspace.
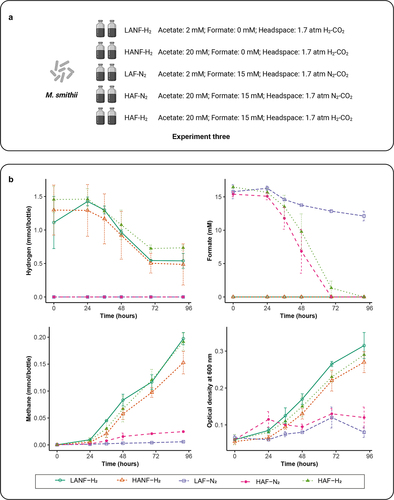
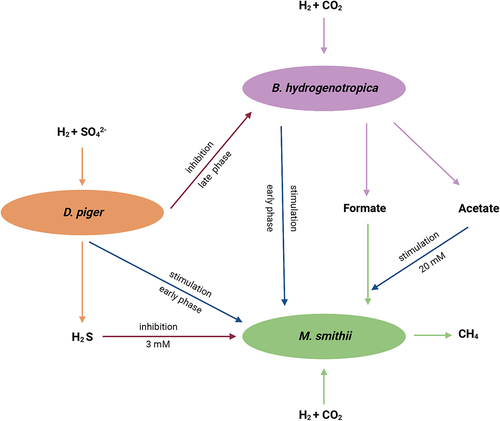
Figure 4. Summary of the interactions between B. hydrogenotrophica, D. piger and M. smithii under hydrogenotrophic conditions.
Supplemental Material
Download MS Word (69.9 KB)Data availability statement
All data generated or analyzed during this study are included in this report and supplementary tables .