
Figures & data
Table 1. Participants characteristics.
Figure 1. Dietary intakes and gut microbial composition differed by IBS subtypes.
(a) Individual nutrients and dietary patterns, standardized using z-score, were assessed using linear models adjusted for sex, age, education, smoking, menopausal status, menopausal hormone therapy, antibiotic use, probiotic use, BMI, and total energy intake. *Adjusted p-values <.10 using Benjamini-Hochberg method. (b) Between-person diversity was measured by Bray-Curtis dissimilarity and its difference by IBS subtype was assessed using PERMANOVA. Figure shows the first two axes of PCoA and numbers in parentheses represent the variance explained by each axis. (c) Within-person diversity was measured using Shannon index and its overall difference across IBS subtype was assessed using Kruskal-Wallis test. Pair-wise differences were tested using Wilcoxon rank sum test. **, p-value < .01; ***, p-value < .001. (d) Individual taxa were assessed using linear models adjusted for above covariates and diet quality. *Adjusted p-values < .10 using Benjamini-Hochberg method.
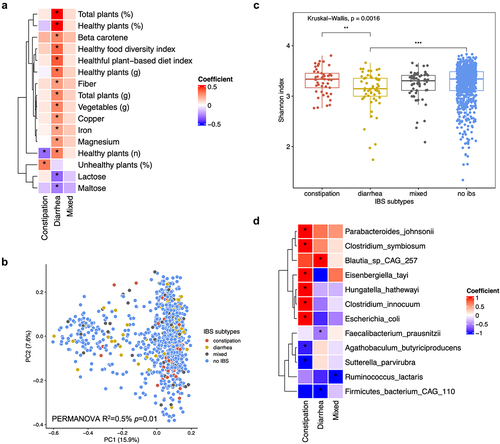
Figure 2. Random forest model classifying IBS subtypes according to gut microbial taxa, functional pathways, and host factors.
(a) IBS-C, (b) IBS-D, and (c) IBS-M were distinguished from non-IBS group and (d) IBS-C was distinguished from IBS-D. A 5-fold cross validation approach was implemented, and the area under the curve (AUC) and 95% confidence intervals were estimated based on a 75/25 random split of training and testing datasets, with 9999 resampling for the bootstrap distribution. A total of 768 taxa, 445 pathways, and 11 host factors (sex, age, education, smoking, menopausal status, hormone therapy, antibiotic use, probiotic use, BMI, diet quality, and total energy intake) were included.
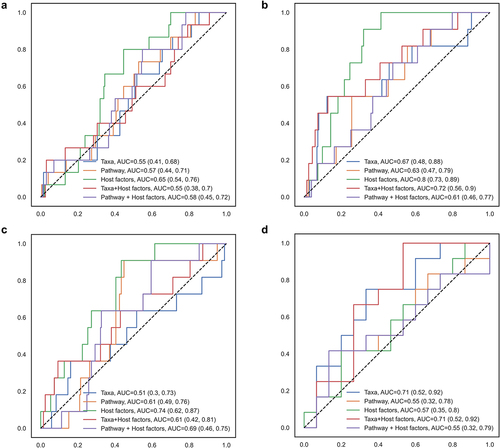
Figure 3. Taxonomic-level results were comparable with prior studies.
(a) The correlation between parameter estimates for specific taxa-IBS associations between our study, Vich Vila et al.Citation8 (results for IBS defined using self-reported Rome III questionnaire), and Jeffery and Das et al.Citation13 (clinically identified IBS using Rome IV criteria) were assessed using Pearson correlation. (b) A cross prediction using random forest classification built upon our dataset (367 overlapping taxa) to distinguish IBS subgroups in Mars et al.Citation9
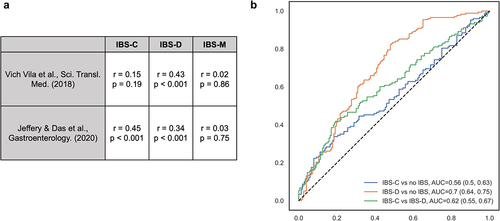
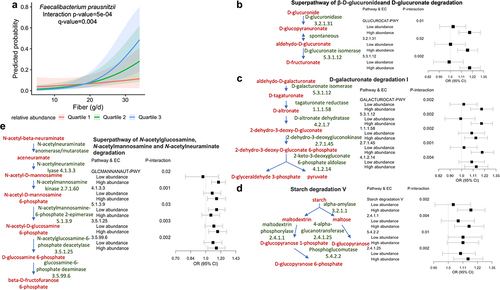
Figure 4. The association between dietary fiber and IBS-D varied by the relative abundance of Faecalibacterium prausnitzii.
Interaction between fiber (continuous variable in g/d) and F. prausnitzii (continuous variable in relative abundance) was assessed using a binomial model adjusted for sex, age, education, smoking, menopausal status, menopausal hormone therapy, antibiotic use, probiotic use, BMI, and total energy intake. For visualization, F. prausnitzii was categorized to quartiles of taxa relative abundance. (a) The probability of having IBS-D was estimated by quartiles of F. prausnitzii while keeping other covariates constant. P-value was adjusted for multiple testing using Benjamini-Hochberg method (q-value). Among metabolic pathways contributed by F. prausnitzii, (b) Superpathway of β-D-glucuronide and D-glucuronate degradation, (c) D-galacturonate degradation I, (d) starch degradation V, (e) Superpathway of N-acetylglucosamine, N-acetylmannosamine and N-acetylneuraminate degradation were the major pathways involved in driving the modifying role of F. prausnitzii in IBS-D response to dietary fiber. Interactions between fiber and each pathway, as well as each enzyme involved in the pathways, was tested in a binomial model adjusted for the above covariates. For visualization, stratified odds ratio (OR) and 95% confidence intervals were estimated for fiber-IBS-D associations according to the median relative abundance of pathways and enzymes. EC, enzyme commission number.
Supplemental material
Supplemental Material
Download PDF (4 MB)Supplemental Material
Download MS Excel (316.4 KB)Data availability statement
Gut metagenome sequencing data can be accessed from the European Nucleotide Archive (accession number: PRJEB39223). Other data, analytical methods, and study materials can be made available to collaborators upon reasonable request from https://twinsuk.ac.uk/resources-for-researchers/access-our-data/.