
Figures & data
Figure 1. Multiple sequencing alignment and three-dimensional structure of p40. (a) multiple sequencing alignment of p40 N-terminal 1–302 residues was performed using MEGA 11. Structural homology was found among Lacticaseibacillus genus. WP_047106723.1: LGG (p40 sequence); WP_129320542.1: lacticaseibacillus chiayiensis, WP_128529452.1: Lacticaseibacillus paracasei; WP_003589573.1: Lacticaseibacillus paracasei; WP_125748689.1: lacticaseibacillus baoqingensis, WP_125710198.1: Lacticaseibacillus porcinae; WP_056964416.1: lacticaseibacillus manihotivorans; WP_223316001.1: Latilactobacillus curvatus. (b) three-dimensional structure of p40 protein predicted by using SWISS-MODEL, alpha-fold, and i-TASSER.
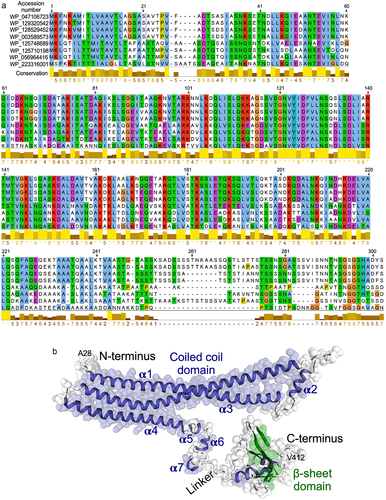
Figure 2. Generation of recombinant p40 peptides. (a) amino acid sequences of p40N120 and p40N180. (b)pET30a DNA vector used to synthesize recombinant p40 peptides. (c) p40F, p40N180 and p40N120 were separated by SDS-PAGE and stained with Colloidal blue staining kit and were analyzed by Western blot analysis using an anti-p40 antibody.
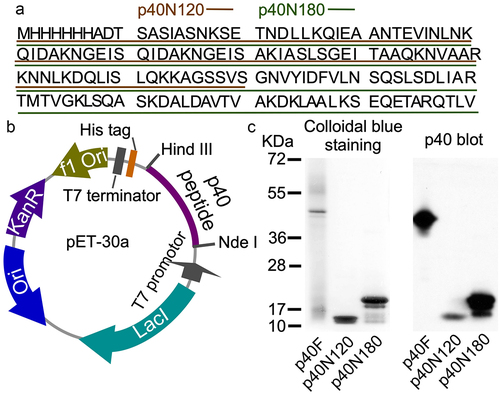
Figure 3. p40N120 upregulates epigenetic program in mouse intestinal epithelial cells in vitro. YAMC cells were treated with p40F, p40N180 and p40N120 at 10 or 50 ng/ml for 4 (a, c, d) or 2 (b, d) hours or TGFβ at 10 ng/ml for 15 minutes (e). (a, c) RNA was isolated from cells for RT-PCR analysis of Setd1b and Tgfb1 mRNA levels. Setd1b and Tgfb1 mRNA expression levels in control groups were set as 1. (b, e) total cellular proteins were prepared from YAMC cells for Western blot analysis using indicated antibodies. β-actin blot was used as the protein loading control. The fold changes of band intensities compared to β-actin in the same sample are shown under the blot. (d) YAMC cell culture supernatants were collected for measuring the amount of TGFβ release using ELISA. TGFβ concentration is presented in picograms per milliliter. **p < .001, *p < .01 compared the control group. #p < .01 compared to the p40F group. In A, C, and D, each symbol represents data from one independent experiment. In B, lanes were run on the same gel but were noncontiguous, as indicated by the white lines. P-SMAD2: phosphorylated; T-SMAD2: total SMAD2.
Figure 4. p40N120 stimulated epigenetic responses in human intestinal epithelial cells. Human colonoids were treated with p40F, p40N180 or p40N120 at 100 ng/ml for 48 hours. (a) colonoids were fixed and stained with hematoxylin and eosin. (b, e) RNA was isolated from colonoids for RT-PCR analysis of the levels of SETD1b and TGFb1 mRNA. Expression levels of SETD1b and TGFb1 mRNA in control groups were set as 1. The mRNA expression levels of treatment groups were compared to the control group. (c, d) colonoid sections were stained using anti-H3K4me1 antibody and Cy3-labeled secondary antibody (red). Nuclei were stained with DAPI (blue). % of H3K4me1 positive cells is shown. **p < .001, *p < .01 compared the control group. #p < .01 compared to the p40F group. Each symbol represents data from one independent colonoid culture experiment.
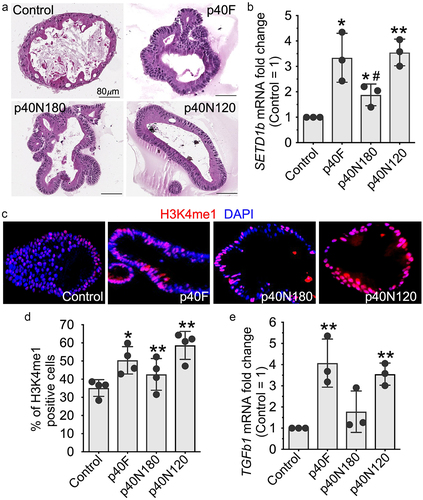
Figure 5. p40N120 supplementation in early life promotes TGFβ production and Treg differentiation in the lamina propria of the colon in adult mice. Foxp3-GFP mice were treated with p40F or p40N120 from postnatal day 2 to day 21. Mice were euthanized at the age of 8 weeks. Paraffin-embedded colon tissues were used to determine H3K4me1 expression by immunohistochemistry using anti-H3K4me1 antibody and Cy3-labeled secondary antibody (red). Nuclei were stained with DAPI (blue). Images were taken using fluorescent microscope at 40X. (b) the number of H3K4me1 positive cells per crypt is shown. (c) RNA was isolated from the colonic tissues for RT-PCR analysis of the Tgfb1 mRNA expression levels. (d) lymphocytes were isolated from the lamina propria of the colon. Representative counter plot of Foxp3 and CD4 are shown. (e) the percentages of CD4+ Foxp3+ cells in total lymphocytes were shown. **p < .001, *p < .01 compared the control group. #p < .01 compared the p40F group. Each symbol represents data from one mouse (b and c) or from 2–3 mice (e).
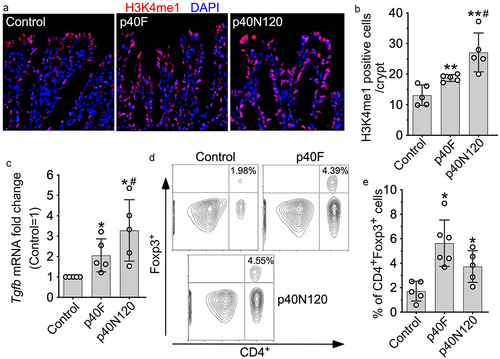
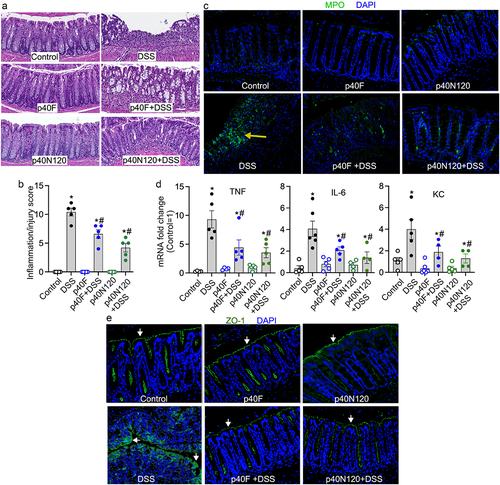
Figure 6. Neonatal p40N120 supplementation prevents colitis in adult mice. Wild-type C57BL/6J mice were treated with p40F or p40N120 from postnatal day 2 to day 21. Colitis was induced by 3% DSS in drinking water for 4 days in mice at the age of 8 weeks. Mice receiving water were used as controls for DSS treatment. (a) colon sections were stained with hematoxylin and eosin for assessment of inflammation. (b) the inflammation/injury scores are shown. (c, e) MPO expression (yellow arrows) and ZO-1 localization (white arrows) in colonic sections were evaluated by immunohistochemistry using anti-MPO and anti-ZO-1 antibodies, respectively, followed by a FITC-labelled secondary antibody (green). Nuclei were stained with DAPI (blue). (d) RNA was isolated from the colonic tissues for RT-PCR analysis of the indicated proinflammatory cytokine mRNA levels. The average of mRNA expression levels in the control mice was set as 100%, and the mRNA expression level of each mouse was compared to this average. *p < .05 compared to the control mice. #p < .05 compared to the DSS control group. Each symbol in B and C represents data from one mouse. In D and E, images represent data from 5 mice in each group.
Supplemental Material
Download MS Word (164.3 KB)Data availability statement
The authors confirm that the data supporting the findings of this study are available within the article.