
Figures & data
Figure 1. In vivo anti-TNF therapeutic response. WT and MCJ-KO mice were treated the first 6 d with DSS and infliximab (IFX) was administrated orally from day 3 to day 6, followed by 3 d of recovery period. All groups are positive for DSS. (a) Weight loss (%) (n = 8 mice per group at minimum). Statistical differences (P value < .05) were observed between WT IFX- and WT IFX+ from day 3 onward (asterisks below WT IFX+ line) and between MCJ KO IFX+ and WT IFX+ at day 3 and from day 5 onward (asterisks above WT IFX- line). (b) Histological scores and representative images of colon tissue (scale bar size, 100 µm). (c) TACE activity in colonic protein extracts (Rfu/mg protein). For statistical analysis two-way ANOVA was performed. Within boxplots, asterisks above boxes versus control genotype (IFX+ versus IFX-) and asterisks above line versus different genotypes in the same experimental group. (Wt_ifxn and MCJ KO_IFXn: DSS positive and IFX negative; WT_IFXp and MCJ KO_IFXp: DSS and IFX positive).
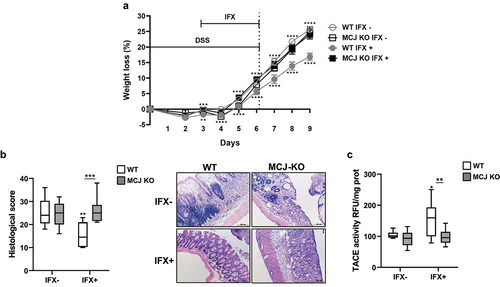
Figure 2. Transcriptomic analysis of intestinal tissue macrophages. (a) Immunofluorescence of MCJ (red) and CD163 (green) in inflamed and healthy adjacent colon tissue from IBD patients. Colocalization is represented in yellow. (b) Principal component analysis showing differences between WT and MCJ-deficient DSS positive colon macrophages´ transcriptomes. (c) HOMER identified several transcription factors enriched in DSS-induced MCJ-KO colon macrophages. (d) venn diagram representing 339 differentially expressed genes found in colon macrophages due to MCJ-KO and a human core rectal UC gene expression signature consisting of 5296 genes.Citation3 Out of 305 genes upregulated in colitis induced MCJ-deficient mice colon macrophages, 183 were shared with the human UC gene signature. (e) venn diagram showing shared genes between upregulated genes due to MCJ-KO in DSS-induced mice colon macrophages and patients refractory to anti-TNF and corticosteroid treatments.
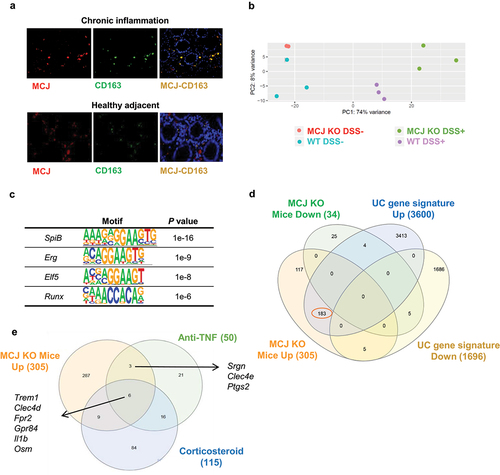
Figure 3. Functional annotation enrichment analysis of inflamed intestinal macrophages according to MCJ levels. RNA-seq data analysis shows 305 upregulated and 34 downregulated genes in MCJ-KO mice treated with DSS compared to control colitis mice (FDR <0.05 and fold change ≥1.5). ClueGO charts related to immunological function reveals (a) upregulation of FCγR signaling pathway (46,7%) in MCJ-KO colitis mice compared to WT colitis (Log2 > 2, P value < 0.05) and (b) downregulation of chaperone cofactor refolding (50%) and microtubule polymerization (50%). Detailed functional annotation enrichment analyses of (c) 305 upregulated and (c) 34 downregulated genes in MCJ-KO colitis mice using ToppGene, ToppCluster and Cytoscape are represented. (c) Pathways related to upregulated genes; immune system (purple), cytokines (orange), cell adhesion and migration (yellow) and other pathways (green). (d) Biological processes enriched by downregulated genes; mitochondrial respiration (blue), cytokines (orange), NOD-like receptors, the intracellular sensors of PAMPS (purple) and heat acclimation (red). (e) Fecal live bacteria percentage (n = 3) and (f) fecal IgG-coated bacteria percentage obtained by flow cytometer (n = 3). For statistical analysis two-way ANOVA was used.
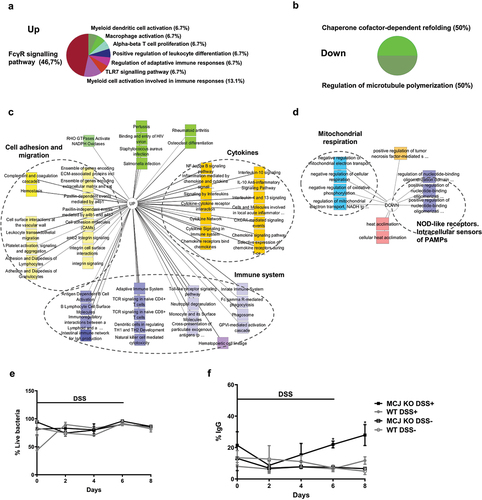
Figure 4. Heatmap of Spearman´s rank correlation coefficients. Bacterial abundances from the 4 experimental groups that were not treated with antibiotic and genes modified by the level of MCJ in colon macrophages upon intestinal inflammation (DSS+) were used. To find associations hierarchical all against all association (HAIIA) was performed. A. muciniphila correlates with Jak2 and R. gnavus with Cst7. The numbers indicate the highest correlation between bacteria and gene expression, having number 1 the highest correlation. Red color illustrates positive correlation and blue negative. In the x axis each column shows a different gene and in the y axis each row shows different bacterial species; Firmicutes (black font), Proteobacteria (red), bacteroidetes (blue), actinobacteria (green) and Verrucomicrobia (purple).
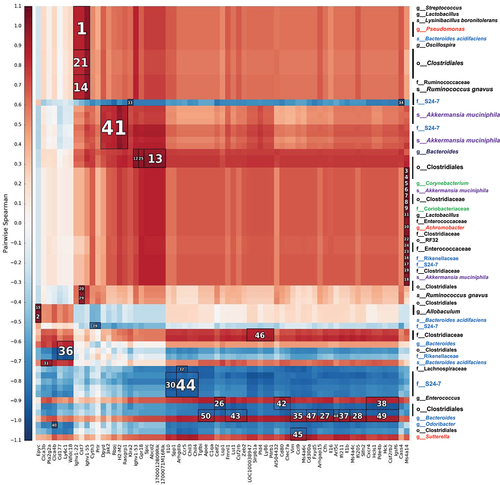
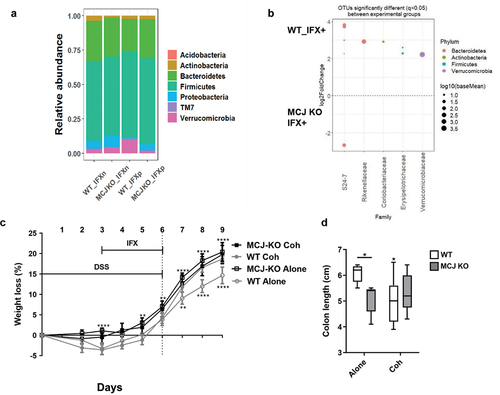
Figure 5. Microbiota composition impact on the anti-TNF therapeutic efficacy. (a) stacked bar plot representation of the relative abundances of colon content taxa at phylum level. (b) differentially abundant OTUs identified through DESeq2 testing (p.Adj <0.05) between WT and MCJ-KO mice treated with anti-TNF agents (WT_P vs MCJ-KO_P). Each point represents a single OTU colored by phylum and grouped by taxonomic family, and point´s size reflect the mean abundance of the sequenced data. To allow microbial transmission between genotypes, WT and MCJ-KO animals were cohoused during 4 weeks prior to colitis induction. (c) weight loss percentage shown as means ± SEM. Asterisks (*) above the line indicate statistical differences between WT and MCJ-KO mice housed alone. Asterisk (*) below the line shows significant differences between WT mice housed alone or cohoused. (d) colonic length (cm). Within boxplots, asterisks above boxes versus control genotype (cohoused versus alone) and asterisks above line versus different genotypes in the same experimental group. Two-way ANOVA (c, e, f) and (d) Mann-Whitney U test were used for statistical analysis. All experimental groups are DSS+ and IFX+.
Supplemental Material
Download TIFF Image (118.8 KB)Supplemental Material
Download TIFF Image (96 KB)Supplemental Material
Download MS Word (42.3 KB)Data availability statement
Raw sequences used for metagenomics analysis were made available at European Nucleotide Archive (ENA www.ebi.ac.uk/ena) under the project number PRJEB33422 for dysbiosis and PRJEB41595 for infliximab experiment. Raw sequences used to perform the transcriptomic analysis were uploaded to GEO (Gene Expression Omnibus) database under project accession code GSE135033 (https://www.ncbi.nlm.nih.gov/geo/query/acc.cgi?&acc=GSE135033).