Figures & data
Figure 1. Low-fiber diet induces deleterious metabolic responses in humanized mice (1a) mouse experimental study design included mice that received donor microbiota from Thai (T) or US (U) human donors, and were placed on either a high-fiber (H) or low-fiber (L) diet for 8 weeks, resulting in four experimental groups: TH = Thailand-donor-high-fiber; UH = US-donor-high-fiber TL = Thailand-donor-low-fiber; UL = US-Donor-low-fiber. After an 8-week diet intervention, n = 2 mice in each group were euthanized. The remaining mice were cohoused by diet: TH and UH were cohoused, and TL and UL were cohoused. Cohousing was performed for only donor pair 1. NDF = non-digestible fiber. (1b) TCRγδ+ and CD8ααTCRαβ+ T cells are significantly elevated in US-donor groups (two-way ANOVA, donor P = .035 and P = .027, respectively), while CD4TCRαβ+ T cells is significantly elevated in Thailand-donor groups (two-way ANOVA, donor P = .016). CD8αβTCRαβ+ T cells are elevated in groups consuming a high fiber (two-way ANOVA, diet P = .032). All other p-values were not significant (>.05). All measurements were taken at week 8 and exclude n = 4 infected mice from the TH group. Points represent counts of live immune cell types normalized by the total count of live CD45+ per mouse small intestine.
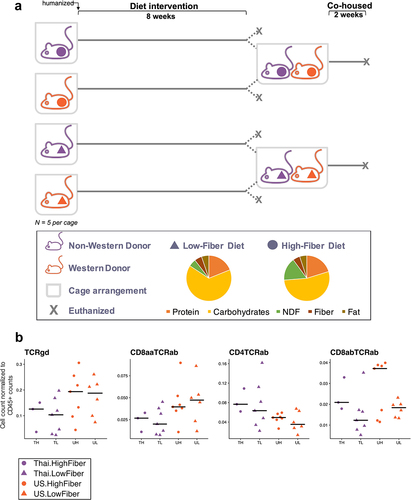
Figure 2. Immune responses in the ileal intra-epithelial compartments, intestinal villi height, and colonic mucus thickness vary by donor microbiota (2a) duodenal crypt depth is significantly deeper in Thailand-donor groups than US-donor groups (two-way ANOVA, donor P = .00034 and diet P = .062). Villus height measurements were not significantly different by donor or diet types. (2b) colonic mucus measurements (three measurements taken per cross-sectional image, measured in triplicate and normalized by researcher) were thicker in Thailand-donor groups (two-way ANOVA, donor P = .0048). (2c) representative images of samples from TH, TL, UH, and UL groups show DAPI stains of cross-sectional colonic sections used for mucus measurements (TH = M13 from Thailand-donor-high-fiber group; TL = M22 from Thailand-donor-low-fiber group; UH = M31 from US-Donor-high-fiber group; UL = M7 from US-Donor-low-fiber group).
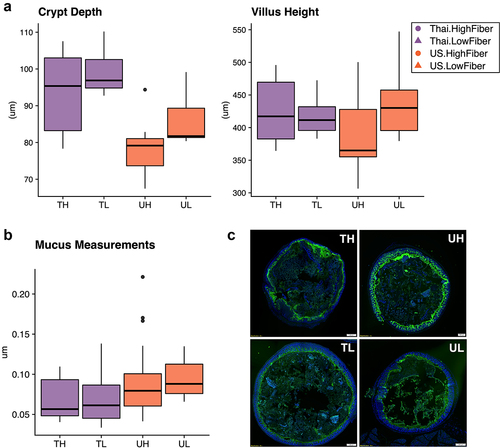
Figure 3. Infection in mice increases mucin production and inflammatory markers (3a) the relative abundances of the 15 most prevalent taxa within each donor pair are shown. Samples were collected at study endpoints (week 8 or 10, depending on whether or not the mouse was cohoused). Note the bloom of Enterobacteriaceae (FDR adjusted q-value = 6.22e-5) and Clostridium (FDR adjusted q-value = .071) in the TH group of donor pair 2, which are composed entirely of the infected mice. Other proteobacteria, enterobacterales, was also elevated in the infected mice (FDR adjusted q-value = .013), but was not prevalent enough in all groups to be shown. TH = Thailand-donor-high-fiber; UH = US-donor-high-fiber; CH = Cohoused TH and UH; TL = Thailand-donor-low-fiber; UL=US-Donor-low-fiber; CL = Cohoused TL and UL. (3b) inclusion of the infected mice elevates both TCRγδ+ and CD8ααTCRαβ+ T cells in the TH group such that the differences between donor groups are no longer significant (two-way ANOVA, donor P = 0.147 and P = .055, respectively). Furthermore, inclusion of the infected mice in the TH group also elevates the counts of CD4TCRαβ+ and CD8αβTCRαβ+ T cells, such that their previous associations are more pronounced (one-way ANOVA, donor P = .012 and diet P = .0079, respectively). Points represent counts of live immune cell types normalized by the total count of live CD45+ cells per mouse small intestine at week 8, and include the n = 4 infected mice in the TH group. (3c) infection in mice leads to increased colonic mucus thickness in the TH group compared to all other groups (one-way ANOVA, P = 6e-16). Points represent mean colonic mucus measurements (five measurements taken per cross-sectional image, measured in triplicate and normalized by researcher). Points in red indicate measurements from the n = 4 infected mice.
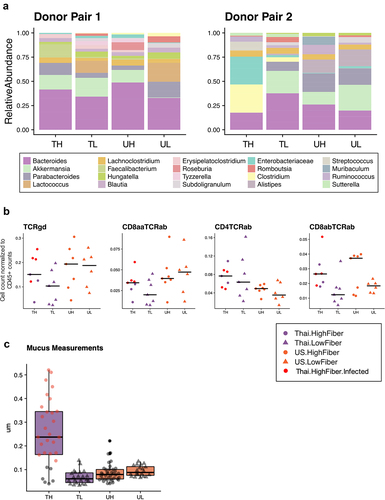
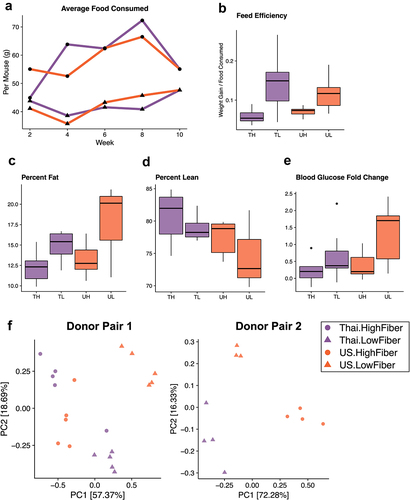
Figure 4. A low-fiber diet leads to deleterious metabolic outcomes (4a) average food consumption per mouse (chow was weighed for each cage at two-week intervals and averaged based on the number of mice per cage) throughout the study period revealed that low-fiber diet groups consistently consumed less food than high-fiber diet groups. (4b) groups consuming a low-fiber diet are more efficient at converting their feed into body weight gain (two-way ANOVA, diet P = 3.2e-05). Feed efficiency is calculated as the gain in body weight per mouse by the average grams of chow consumed per mouse between weeks 6 and 8. (4c) groups consuming a low-fiber diet gain more body fat than those on a high-fiber diet (two-way ANOVA, diet P = .013). Body fat was measured at the end of the 8-week diet intervention. (4d) Thai-donor groups gained more lean mass than US-donor groups (two-way ANOVA donor P = .032). (4e) groups consuming a low-fiber diet exhibited a significant difference in fasting blood glucose fold change (two-way ANOVA, diet type variable P = .012). Fasting blood glucose measurements were taken at baseline (prior to gavage) and at the end of the 8-week diet intervention (time of sacrifice). (4F) PCoA of mouse microbiota (weighted UniFrac) at 8 weeks show clustering by diet (ANOSIM R = .7267, P = .001) and donor microbiota (ANOSIM R = .09222, P = .119) in donor pair 1, and by diet (ANOSIM R = .9656 and P = .004) and donor microbiota (ANOSIM R = .5767 and P = .01) in donor pair 2. PCoAs are separated by donor-pair for clarity and to observe the differences in donor pair gut microbiota. Due to the outlier effects of the infected mouse samples, donor pair 2 Thai-high-fiber samples are excluded. TH = Thailand-donor-high-fiber; TL = Thailand-donor-low-fiber; UH = US-donor-high-fiber; UL = US-Donor-low-fiber. See also Figure S3 and Table S2.