
Figures & data
Figure 1. Heterogeneity of mouse influenza resistance is closely associated with gut metabolites.
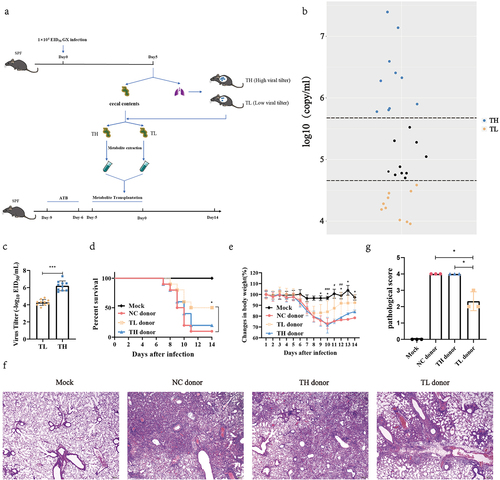
Figure 2. The influenza resistance of infected mice is associated with the enrichment of several gut metabolites.
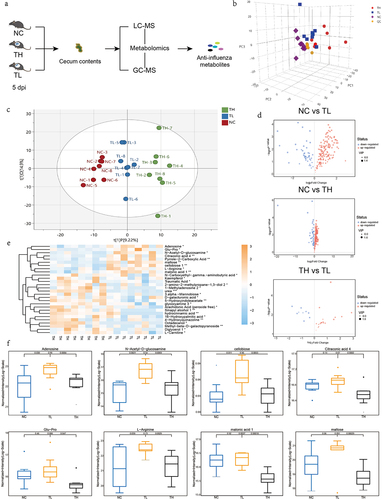
Figure 3. GlcNAc and adenosine exert anti-influenza effects in vivo and in vitro, respectively.
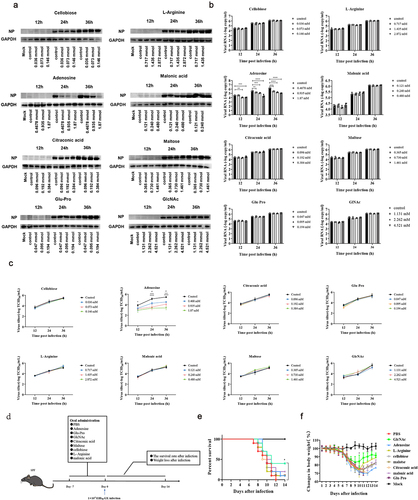
Figure 4. Oral administration of GlcNAc protects against H7N9 infection in recipient mice.
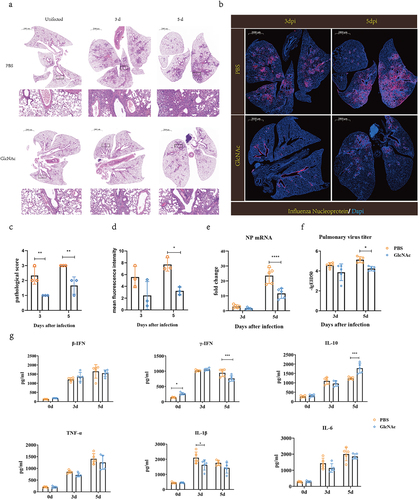
Figure 5. Oral administration of GlcNAc enhances NK cell responses before and after infection in mice.
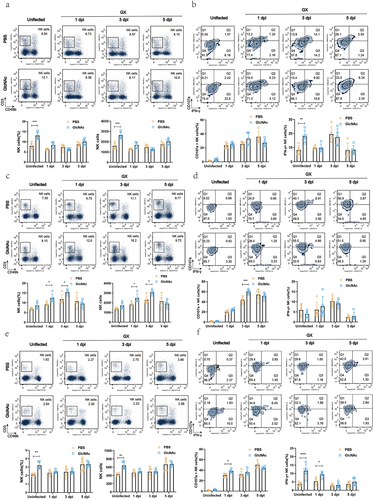
Figure 6. GlcNAc improves host defense against H7N9 infection by regulating NK cells.
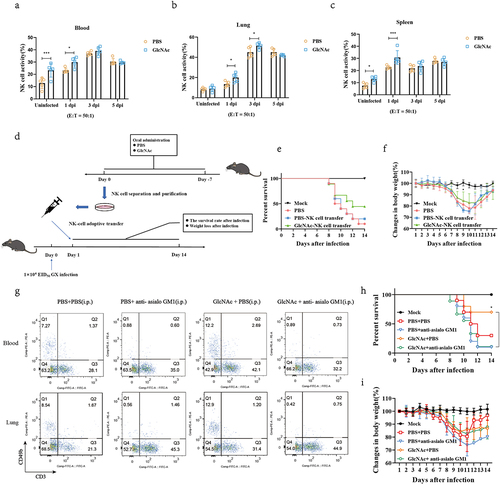
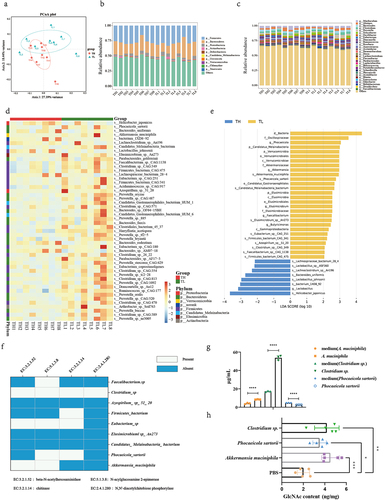
Figure 7. Upregulation of specific microbiota increased GlcNAc production in the gut.
Supplemental Material
Download Zip (19 MB)Data availability statement
The datasets generated in the current study were deposited to the NCBISRA database under the BioProject accession PRJNA861413. The metabolomics datasets generated and analyzed during the current study are available in the MetaboLights repository, using accession number MTBLS5410, http://www.ebi.ac.uk/metabolights/MTBLS5410. Raw data for UHPLC – MRM-MS is publicly available upon acceptance at: https://doi.org/10.6084/m9.figshare.20377545.v1 and https://doi.org/10.6084/m9.figshare.24042927.v1. All other relevant data are available from the corresponding authors upon reasonable requests, after signing a data access agreement. Correspondence and requests for materials should be addressed to Meilin Jin or Qiang Zhang.