
Figures & data
Figure 1. Dysbiosis of intestinal microbiota in LRRK2-associated sPD. (a-c) Boxplots of α-diversity as measured by observed number of ASVs (a), Shannon diversity (b), and Simpson diversity (c) from the fecal microbiota at genus level in terms of 16S rDNA amplicon sequencing among LRRK2+/sPD+, LRRK2+/sPD- and HCs. Box elements show the median, minimum, and maximum values. (d) PCoA plot based on Bray-Curtis dissimilarities of the fecal microbiota at genus levels in terms of 16S rDNA sequencing among LRRK2+/sPD+, LRRK2+/sPD-, and HCs. Ellipses show 95% confidence intervals. (e) ROC analysis based on the levels of E. coli for two-way classification models of LRRK2+/sPD+, LRRK2+/sPD- and HCs. (f) Bar plots of the species levels in fecal samples based on metagenomic sequence analysis among LRRK2+/sPD+ (n = 51), LRRK2+/sPD- (n = 21), and HCs (n = 30). (g) Relative abundance distributions of fecal microbiota at species levels in terms of metagenome sequencing among LRRK2+/sPD+, LRRK2+/sPD-, and HCs (left). Data are expressed as the median, minimum, and maximum (right). The following n values represent the number of independent individuals for statistical evaluation: (a-e, g), LRRK2+/sPD+ = 51, LRRK2+/sPD- = 21, HCs = 30. Data are analyzed by Permutational Multivariate analysis of Variance (PERMANOVA) (d), one-way ANOVA with Tukey’s multiple comparison test (a-c, e), and covariate-adjusted random coefficient regressions (g). *p < .05, **p < .01, ***p < .001, ****p < .0001.
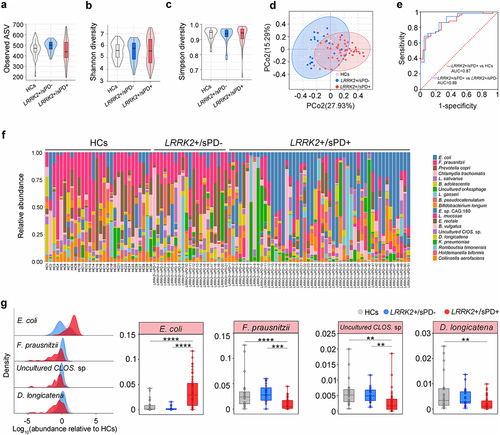
Figure 2. Lrrk2 R1628P transgenic mice exhibit intestinal dysfunctions due to the pathological activation of LRRK2. (a) Representative immunoblot images of E-cadherin, β-catenin, pS935 LRRK2, total LRRK2, pT73 Rab10, and Rab10 levels in the colons of WT, Lrrk2RP/+, and Lrrk2RP/RP at 52 weeks (left) and quantification (right). (b) Representative immunofluorescence images of E-cadherin (green) and β-catenin (magenta) in the colons of WT, Lrrk2RP/+, and Lrrk2RP/RP at 52 weeks (left) and quantification of E-cadherin and β-catenin fluorescence intensity. (c) ELISA quantification of α1-AT, LF and CALP in fecal samples of WT, Lrrk2RP/+, and Lrrk2RP/RP at 52 weeks (left) and quantification (right). (d) Representative images of colon length in WT, Lrrk2RP/+ and Lrrk2RP/RP at 52 weeks (left) and quantification (right). (e) Behavioral analysis of WT, Lrrk2RP/+, and Lrrk2RP/RP at 52 weeks. Motor performance was evaluated by the beam working test, the hanging-wire grip test, rotarod test and open field test of the total distance traveled. Exploratory behavior was evaluated by open field test of the center time. Gastrointestinal function was evaluated by the defecation time of black feces. Experimental data for (a-e) were obtained from seven independent mice, with similar results obtained. Data are shown as the mean ± SD with p values by one-way ANOVA with Tukey’s multiple comparison’s test (a-e). *p < .05, **p < .01, ***p < .001, ****p < .0001. (b) Scale bar, 20 μm.
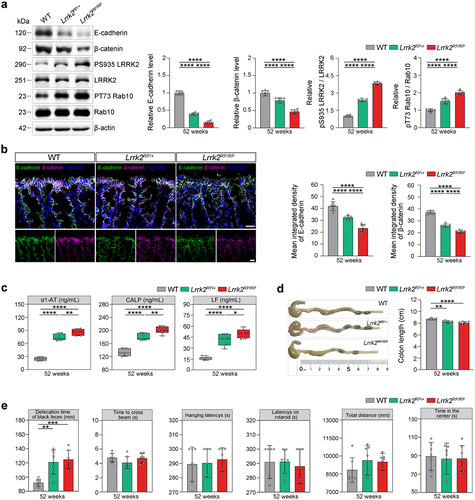
Figure 3. Pathological α-syn is triggered by E. coli and reversed by FMT in the colon of Lrrk2RP/+ mice. (a) Timeline schematic of the experimental design showing the procedures of E. coli administration and FMT in Lrrk2RP/+. (b) PCoA plot of fecal microbiota data at genus-level in terms of 16S rDNA sequencing among the WT, Lrrk2RP/+ PBS, Lrrk2RP/+ E. coli, Lrrk2RP/+ E. coli-PBS, and Lrrk2RP/+ E. coli-FMT at 24 wpfg. Ellipses represent a 95% confidence interval. (c) Species-level taxonomic analysis of the intestinal microbiota composition using metagenomic sequencing among the WT, Lrrk2RP/+ PBS, Lrrk2RP/+ E. coli, Lrrk2RP/+ E. coli-PBS and Lrrk2RP/+ E. coli-FMT at 24 wpfg. (d) HPLC analysis of dopamine levels in colonic and fecal samples from Lrrk2RP/+ PBS, Lrrk2RP/+ E. coli, Lrrk2RP/+ E. coli-PBS and Lrrk2RP/+ E. coli-FMT at 24 wpfg. (e) Representative images of colon length in Lrrk2RP/+ PBS, Lrrk2RP/+ E. coli, Lrrk2RP/+ E. coli-PBS and Lrrk2RP/+ E. coli-FMT at 24 wpfg (left), and quantification (right). (f) gastrointestinal function was evaluated by the defecation time of black feces among Lrrk2RP/+ PBS, Lrrk2RP/+ E. coli, Lrrk2RP/+ E. coli-PBS and Lrrk2RP/+ E. coli-FMT at 9, 12, 15, 17, 18, 21, and 24 wpfg, respectively. (g) Representative immunohistochemical images of pα-syn and α-syn aggregates in the colon of Lrrk2RP/+ PBS, Lrrk2RP/+ E. coli, Lrrk2RP/+ E. coli-PBS and Lrrk2RP/+ E. coli-FMT at 15, 18, and 24 wpfg, respectively(left). Quantification used the % area occupied with pα-syn and α-syn aggregates (right). (h) Representative images of E-cadherin (green), curli (magenta) and pα-syn (red) in the colon of Lrrk2RP/+ PBS, Lrrk2RP/+ E. coli, Lrrk2RP/+ E. coli-PBS and Lrrk2RP/+ E. coli-FMT (left). Quantification of E-cadherin, curli and pα-syn fluorescence intensity at 15, 18, and 24 wpfg, respectively (right). (i) Representative images of HE staining in the colon of Lrrk2RP/+ PBS, Lrrk2RP/+ E. coli, Lrrk2RP/+ E. coli-PBS and Lrrk2RP/+ E. coli-FMT (left). Quantification of the histological scores at 15,18 and 24 wpfg, respectively(right). Experimental data for (b-i) were obtained from seven independent mice, with similar results obtained. Data are analyzed by PERMANOVA (b), Kruskal-Wallis test with two-stage linear step-up procedure of Benjamini, Krieger and Yekutieli multiple comparison’s test (c), one-way (c-e) or two-way (f-i) ANOVA with Tukey’s multiple comparison’s test. *p < .05, **p < .01, ***p < .001, ****p < .0001. Scale bar, 20 μm (g-i).
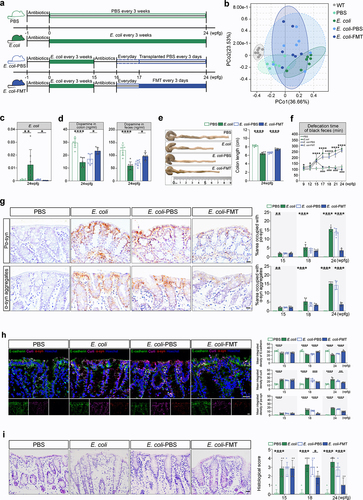
Figure 4. PD-like phenotypes are triggered by E. coli and reversed by FMT in Lrrk2RP/+ mice brain. (a) Representative immunohistochemical images of pα-syn in the 10N, SNc, STR, and PFC of Lrrk2RP/+ PBS, Lrrk2RP/+ E. coli, and Lrrk2RP/+ E. coli-FMT (left), respectively. Quantification used the % area occupied with pα-syn at 15, 18 and 24 wpfg, respectively. (b) Representative immunoblot images of pS129 α-syn in the insoluble fractions of the midbrain in Lrrk2RP/+ PBS, Lrrk2RP/+ E. coli, Lrrk2RP/+ E. coli-PBS, and Lrrk2RP/+ E. coli-FMT at 24 wpfg (left) and quantification (right). (c) Representative images of pα-syn (magenta) with MAP2 (green), GFAP (green), iba-1 (green), or ubiquitin (green) of Lrrk2RP/+ E. coli at 24 wpfg. Co-immunolabeling is represented by the signal in white. Cell nuclei were counterstained with Hoechst. (d) Representative immunohistochemical images of TH+ neurons in SNc in Lrrk2RP/+ PBS, Lrrk2RP/+ E. coli, Lrrk2RP/+ E. coli-PBS and Lrrk2RP/+ E. coli-FMT (left). Quantification of TH immunoreactivity from mice at 24 wpfg, respectively (right). (e) HPLC analysis of dopamine levels in midbrain of Lrrk2RP/+ PBS, Lrrk2RP/+ E. coli, Lrrk2RP/+ E. coli-PBS and Lrrk2RP/+ E. coli-FMT at 24 wpfg. (f) Representative TUNEL staining for cell apoptosis in the SNc of Lrrk2RP/+ PBS, Lrrk2RP/+ E. coli, Lrrk2RP/+ E. coli-PBS and Lrrk2RP/+ E. coli-FMT at 24 wpfg (left) and quantification (right). (g) ELISA analysis for IL-6 and TNF-α level in midbrain and striatum of Lrrk2RP/+ PBS, Lrrk2RP/+ E. coli, Lrrk2RP/+ E. coli-PBS and Lrrk2RP/+ E. coli-FMT at 24 wpfg. (h) Kaplan-Meier survival curves of Lrrk2RP/+ PBS, Lrrk2RP/+ E. coli, Lrrk2RP/+ E. coli-PBS and Lrrk2RP/+ E. coli-FMT. (i) Behavioral analysis of Lrrk2RP/+ PBS, Lrrk2RP/+ E. coli, Lrrk2RP/+ E. coli-PBS and Lrrk2RP/+ E. coli-FMT at 9, 12, 15, 17,18, 21, and 24 wpfg, respectively. Experimental data for (a-i) were obtained from seven independent mice, with similar results obtained. Data are shown as the mean ± SD with p values by two-way (a, i) or one-way (b-g) ANOVA with Tukey’s multiple comparison’s test and log-rank (mantel-cox) test (h). *p < .05, **p < .01, ***p < .001, ****p < .0001(Lrrk2RP/+ PBS versus Lrrk2RP/+ E. coli) (up); #p < .05, ##p < .01, ###p < .001, ####p < .0001 (Lrrk2RP/+ E. coli-PBS versus Lrrk2RP/+ E. coli-FMT) (down) Scale bar, 20 μm (a, c and f), 25 μm (d).
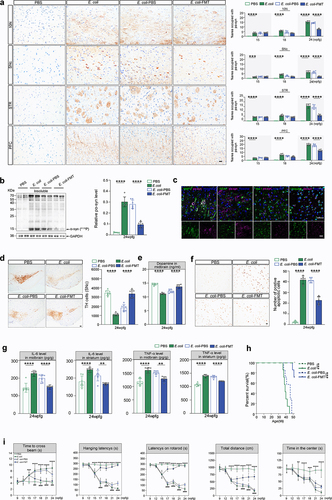
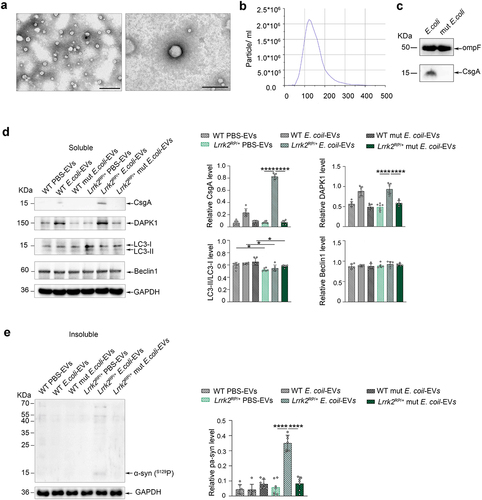
Figure 5. Co-occurrence of increased α-syn phosphorylation and autophagic impairment triggered α-syn aggregation in Lrrk2 R1628P mice. (a) characterization of intestinal E. coli-derived extracellular vesicles (EVs). Transmission electron microscopy image of E. coli-derived EVs at different magnifications. (b) size distribution of E. coli-derived EVs according to diameter as determined by nanoparticle tracking analysis. (c) Representative immunoblot images of OmpF and CsgA levels in E. coli-derived EVs and mut E. coli-derived EVs. (d) Representative immunoblot images of CsgA, DAPK1, LC3-II/LC3-I, Beclin1 levels in the soluble fractions of colon in Lrrk2RP/+ (Lrrk2RP/+ E. coli-EVs, Lrrk2RP/+ mut E. coli-EVs, Lrrk2RP/+ PBS-EVs) and WT (WT E. coli-EVs, WT mut E. coli-EVs, WT PBS-EVs) at 8 weeks after injection (left) and quantification (right). (e) Representative immunoblot images of pS129 α-syn in the insoluble fractions of the colons in Lrrk2RP/+ E. coli-EVs, Lrrk2RP/+ mut E. coli-EVs, Lrrk2RP/+ PBS-EVs, WT E. coli-EVs, WT mut E. coli-EVs, and WT PBS-EVs mice at 8 weeks after injection (left) and quantification (right). Experimental data for (c-e) were obtained from seven independent mice, with similar results obtained. Data are shown as the mean ± SD with p values by one-way ANOVA with Tukey’s multiple comparison’s test (a-e). *p < .05, **p < .01, ***p < .001, ****p < .0001. Scale bar, left 1.0 μm, right 200 nm (a).
Supplemental Material
Download MS Word (45 MB)Data availability statement
Metagenomic data were analyzed using custom software that is available at CRAN (https://cran.r-project.org/web/packages/pheatmap/index.html, http://CRAN.R-project.org/package=ggplot2). All relevant data supporting the findings of this study are either included within the article and its Additional Information files or are available upon request from the corresponding author. The mouse model will be made available on request.