
Figures & data
Figure 1. NK cell frequency and function change with the progression of alcoholic liver disease. (a) flow diagram. (b) flow cytometry analysis gating strategy. (c) flow cytometry analysis of PBMCs isolated from human blood. (d) frequency of NK cell activation receptor (NKp46) and NK cell with cytotoxic function in CD3−CD56+ NK cells. (e) correlation between alcoholic hepatitis severity score, MDF score, and NK cell function. Data are presented as the mean ± SEM. *p < .05, **p < .01 compared to corresponding controls using unpaired t test between the two groups. Abbreviations: ALD, alcoholic liver disease; AH, alcoholic hepatitis; ALC, alcoholic liver cirrhosis; MDF, maddrey’s discriminant function.
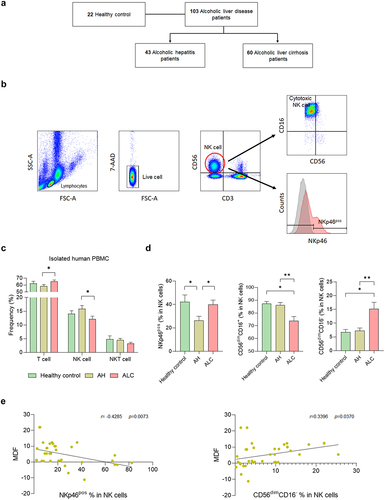
Figure 2. Comparisons of relative abundances of gut microbiome and functional biomarkers between healthy control and ALD patients. (a) beta diversity (principal coordinates analysis). (b) phylum composition of healthy control, alcohol fatty liver, AH, ALC patients. (c) the relative abundance of Firmicutes, Bacteroidetes and F/B ratio (%). (d) the genus composition of healthy control, alcohol fatty liver, AH, ALC patients. (e) alpha diversity through ACE and CHAO, which are species richness indicators, and Shannon analysis, which is species evenness indicators. (g) abundance of P. dorei and L. helveticus groups. (f) heatmap analysis with taxonomic biomarker LDE score > 4. (h) pathway and orthology analysis in functional biomarkers (LEfSe analysis). Data are presented as the mean ± SEM. *p < .05, **p < .01 compared to corresponding controls using unpaired t test between the two groups. Abbreviation: ACE, abundance-based coverage estimators; LDA, linear discriminant analysis; LEfSe, linear discriminant analysis effect size.
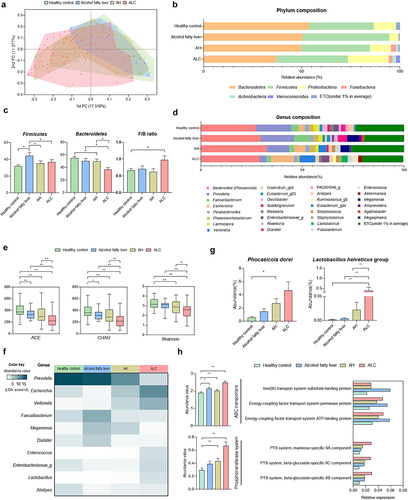
Figure 3. Results of histopathological changes in liver supplemented with P. dorei and L. helveticus in the chronic-plus-binge alcohol feeding model (NIAAA model). (a) scheme of the animal experiment. (b) changes in body weight, liver weight, and L/B ratio (%). (c) liver tissue pictures and H&E staining of liver tissue. Fatty change, inflammation grade, and fibrosis stage scores were evaluated through H&E-stained liver tissue. Data are presented as the mean ± SEM. #p < .05, ##p < .01 compared EtOH-fed and normal groups using an unpaired t test between the two groups. *p < .05, **p < .01 compared EtOH-fed and strain groups using an unpaired t test between the two groups.
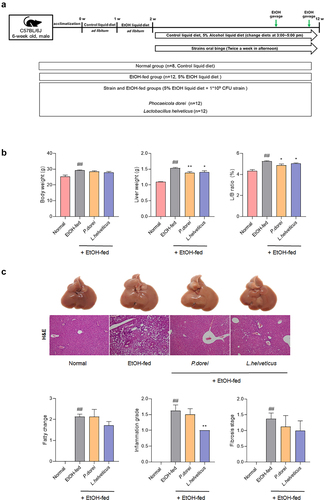
Figure 4. Effects of strains on expression of genes related to inflammation and immune response in chronic-plus-binge alcohol feeding model (NIAAA model) mouse liver. Liver tissue was collected and total RNA for RT-PCR analysis and protein for western blot were extracted. (a) LBP ELISA assay in mouse serum. Hepatic mRNA expression level of (b, e) pro-inflammatory cytokine and (c) chemokine genes that play an important role in immune and inflammatory control. Western blot analysis of the protein expression level of (d) COX-2 and (f) MAPK signaling pathway in liver tissue. Data are presented as the mean ± SEM. #p < .05, ##p < .01 compared EtOH-fed and normal groups using an unpaired t test between the two groups. *p < .05 compared EtOH-fed and strain groups using an unpaired t test between the two groups. Abbreviation: LBP, lipopolysaccharide binding protein; TNF-α, tumor necrosis factor α; IL, interleukin; TLR2, toll-like receptor 2; CXCL, C-X-C motif chemokine ligand; CCL, CC motif chemokine ligand; IFN-γ, interferon gamma; MAPK, mitogen-activated protein kinase.
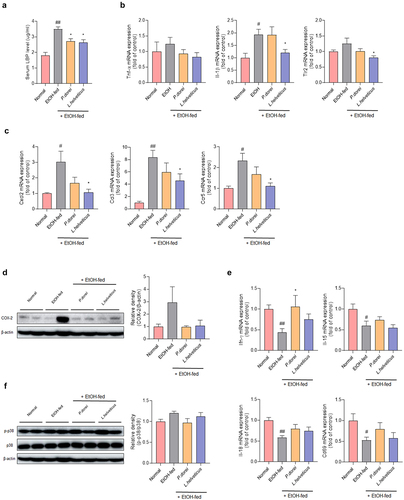
Figure 5. Effect of strains on recovery of impaired intestinal barrier caused by ethanol feeding in chronic-plus-binge alcohol feeding model (NIAAA model). Colon tissue was collected and total RNA for RT-PCR analysis and protein for western blot were extracted. (a) RT-PCR analysis and (b) western blot analysis of tight junction protein genes in mouse colon tissue. Data are presented as the mean ± SEM. ##p < 0.01 compared EtOH-fed and normal groups using an unpaired t test between the two groups. *p < .05, **p < .01 compared EtOH-fed and strain groups using an unpaired t test between the two groups.
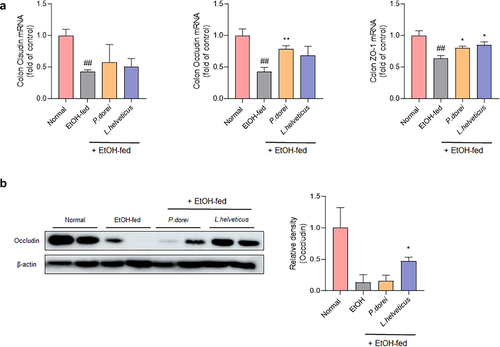
Figure 6. Effects of strains that increase the activity and function of NK cells that have been reduced by ethanol intake. (a) flow cytometry analysis of liver MNCs isolated from NIAAA model. (b) flow cytometry analysis of subsets of NK cells gated with NK1.1 and CD3. (c) hepatic mRNA expression levels of NK cell transcription factor genes. (d) frequency of activating receptor expression in NK cells gated with NK1.1 and CD3. (e) RT-PCR analysis of granzyme B and perforin in mouse liver NK cell. Data are presented as the mean ± SEM. #p < .05, ##p < .01 compared EtOH-fed and normal groups using an unpaired t test between the two groups. *p < .05, **p < .01 compared EtOH-fed and strain groups using an unpaired t test between the two groups.
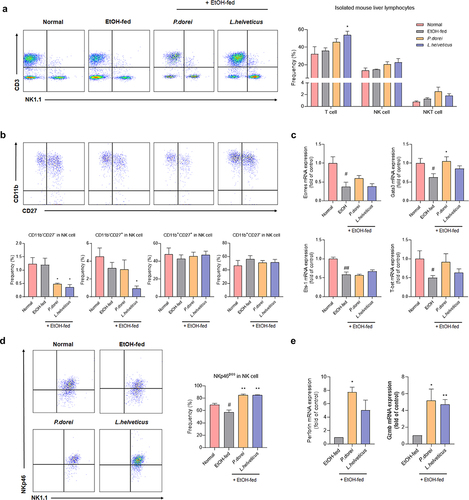
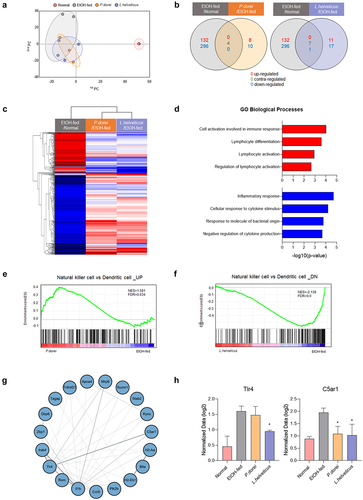
Figure 7. Results of QuantSeq mRNA-seq analysis in chronic-plus-binge alcohol feeding model (NIAAA model). (a) PCA based on the expression value of all genes in the sample. (b) venn diagram showing the difference in total gene expression between the EtOH-fed group and the strain group. (c) clustering heatmap analysis showing the similarity between samples and genes. (d) GO biological process analysis of the strain group compared to the EtOH-fed group using metascape. (e) GSEA analysis of upregulated gene expression in NK cells increased by P. dorei administration. (f) GSEA analysis of downregulated gene expression in NK cells reduced by L. helveticus administration. (g) Cytoscape STRING analysis of gene correlation based on protein-protein interaction. (h) genes involved in inflammation and immune response with significantly different expression. Abbreviation: PCA, principal component analysis; GO, gene ontology; NES, normalized enrichment score; FDR, false discovery rate.
Supplementary file.docx
Download MS Word (1.1 MB)Data availability statement
The authors confirm that the data supporting the findings of this study are available within the article and its supplementary materials.