
Figures & data
Figure 1. Supplementation with the probiotic mix attenuates weight gain and fat mass accumulation and metabolic alterations in HF diet-fed mice. (a) body weight evolution (n = 12–16). (b) body weight gain at 12 weeks. (c) epididymal white adipose tissue (eWAT), mesenteric white adipose tissue (mWAT), inguinal white adipose tissue (iWAT) and liver weights at sacrifice. (d cumulative food intake recorded during 10 weeks. (e) liver triglycerides and total cholesterol. (f) oil-red O liver sections and liver lipid droplet size (n = 6–12); 60× magnification; bar = 25 µm. (g) fasting blood glucose level (n = 15–16). (h) fasting plasma insulin level (n = 5). Data are mean ± SEM. $p <0.05, #p <0.01, ¤p <0.001 versus the Chow diet group and *p <0.05, **p <0.01, ***p <0.001 for the HF-Pr2 versus the HF group.
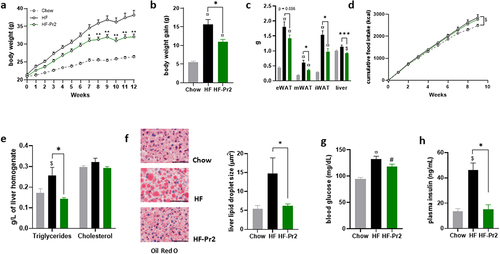
Figure 2. Effects of the probiotic mix on gene expression in the liver and eWAT. (a) relative mRNA expression levels of lipid metabolism-related genes in the liver: hepatic lipase (LipC), CD36 antigen (CD36), sterol regulatory element binding transcription factor 1 (Srebp-1c), fatty acid synthase (Fasn), and diacylglycerol O-acyltransferase 2 (Dgat2) (n = 7–10). (b) relative mRNA expression levels of lipid metabolism-related genes in eWAT: lipoprotein lipase (Lpl), low density lipoprotein receptor (Ldl-r), CD36 antigen (CD36), diacylglycerol O-acyltransferase 2 (Dgat2), hormone sensitive lipase (Hsl) and adipose triglyceride lipase (Atgl) (n = 5–8). (c) relative mRNA expression levels of oxidative stress and ER stress-related genes in the liver: glutathione peroxidase 1 (Gpx1) and 4 (Gpx4), Catalase (Cat), peroxiredoxin 3 (Prdx3), superoxide dismutase 1 (Sod1) and 2 (Sod2), glutathione S-transferase alpha 4 (Gsta4), heat shock 70kDa protein 5 (Hspa5), activating transcription factor 4 (Atf4) and DNA-damage inducible transcript 3 (Ddit3). (d) relative mRNA expression levels of inflammation-related genes in eWAT: tumor necrosis factor alpha (Tnfα), chemokine (C-C motif) ligand 2 (Ccl2), interleukin 6 (iIl-6), Lipocalin 2 (Lcn2), Adiponectin (Adipoq) and leptin (Lep). Data are mean ± SEM. $p <0.05, #p <0.01, ¤p <0.001 versus the Chow diet group and *p <0.05, **p <0.01, ***p <0.001 for the HF-Pr2 versus the HF group.
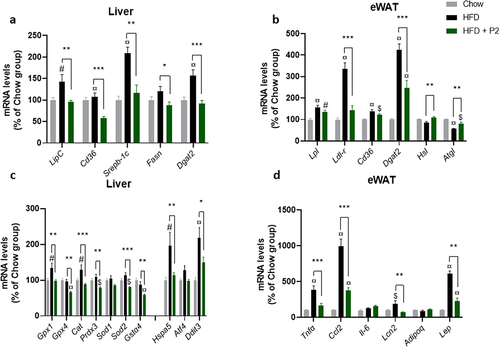
Figure 3. Effects of supplementation with the probiotic mix on intestinal lipid uptake. (a) plasma triglyceride concentrations throughout the oral lipid tolerance test (OLTT) (n = 9–11). (b) area under the curve (AUC) of plasma TGs during OLTT. Relative mRNA expression levels of lipid absorption-related genes in the jejunum (c) and ileum (d) Cd36, fatty acid binding protein 2 (Fabp2), diacylglycerol O-acyltransferase 1 (Dgat1), Microsomal triglyceride transfer protein (Mttp), apolipoprotein B (ApoB) and Surfeit4 (Surf4) (n = 7–10). Data are mean ± SEM. $p <0.05, #p <0.01, ¤p <0.001 versus the Chow diet group and *p <0.05, **p <0.01 for the HF-Pr2 versus the HF group.
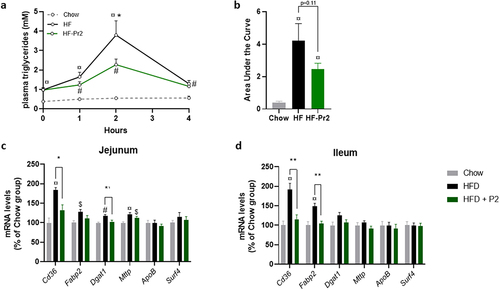
Figure 4. Impacts of supplementation with the probiotic mix on gut microbiota composition. (a) alpha-diversity based on observed OTUs, Chao1 index and Shannon indexes. (b) multidimensional scaling of Bray-Curtis dissimilarity (MDS). (c) Firmicutes/Bacteroidetes ratio. (d) pie charts showing relative abundance of the most abundant phyla. Data are mean ± SEM. #p <0.01 versus the Chow diet group.
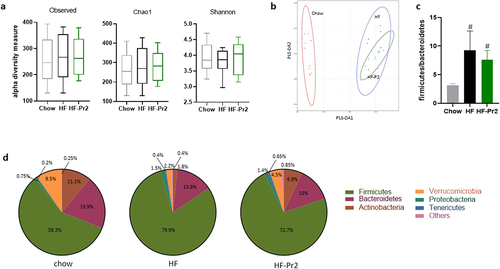
Table 1. Description of the 17 ASVs with significant change in relative abundance in the feces of the probiotic-treated mice compared to HF fed mice.
Figure 5. Effects of supplementation with the probiotic mix on regulatory pathways in the ileum. (a) incretin pathway. Relative mRNA expression levels of G protein-coupled bile acid receptor 1 (Gpbar1), glucagon (Gcg) and gastric inhibitory polypeptide (Gip) in the ileum. (b) endocannabinoid pathway. Relative mRNA expression levels of N-acyl phosphatidylethanolamine phospholipase D (Napepld), N-acylethanolamine acid amidase (Naaa) and fatty acid amide hydrolase (Faah) in the ileum. (c) Ahr pathway. Relative mRNA expression levels of Aryl-hydrocarbon receptor repressor (Ahrr), cytochrome P450 family 1 subfamily a polypeptide 1 (Cyp1a1) and cytochrome P450 family 1 subfamily b polypeptide 1 (Cyp1b1) in the ileum. (d) FXR-Fgf15 pathway. Relative mRNA expression levels of nuclear receptor subfamily 1 group H member 4 (Nr1h4), nuclear receptor subfamily 0 group B member 2 (Nr0b2) and fibroblast growth factor 15 (Fgf15) in the ileum. Data are mean ± SEM (n = 7–10). ¤p <0.001 versus the Chow diet group and **p <0.01, ***p <0.001 for the HF-Pr2 versus the HF group.
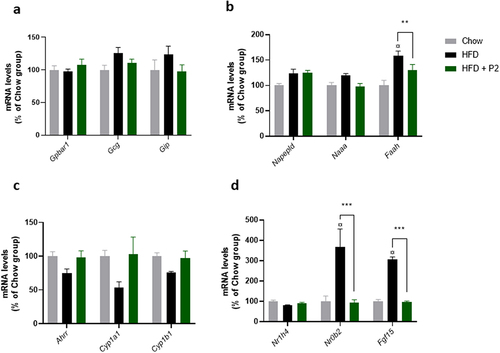
Figure 6. Effects of the probiotic mix on bile acid (BA) profile in the caecum. (a) concentration of total BAs in the caecum. (b) amount of primary BAs (CA, CA-3S, CDCA, TCDCA, TCA, HCA, β-MCA and TMCA). (c) amount of secondary BAs (DCA, TDCA, LCA, ω-MCA, HDCA and THDCA). (d) primary and secondary BA ratio. (e) BA profile in the caecum. (f) FXR antagonists/FXR agonists ratio. Data are mean ± SEM (n = 6–10). #p <0.01, ¤p <0.001 versus the Chow diet group and *p <0.05 for the HF-Pr2 versus the HF group.
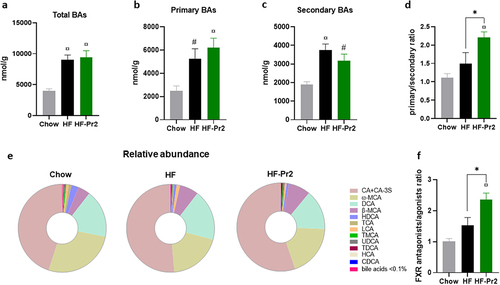
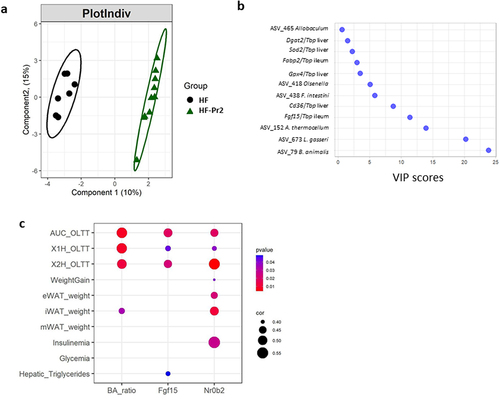
Figure 7. A multivariate approach highlights significant separation between HF and HF-Pr2 groups and the potential role played by the inhibition of intestinal FXR pathway in the beneficial effects of the probiotic mix. (a) partial least squares-discriminant analysis (PLS-DA) plot of individual mice from HF and HF-Pr2 groups and (b) Variable Importance in the project (VIP) representation of the most discriminant features identified by PLS-DA. (c) correlation plot of indexes of intestinal FXR inhibition (Ba_ratio = ratio of FXR antagonist/agonist bile acid species), Fgf15 (Fgf15/Tbp mRNA ratio measured in the ileum) and Nr0b2 (Nr0b2/Tbp mRNA ratio measured in the ileum) and MetS related parameters (X1H_OLTT and X2H_OLTT correspond to the plasma TG values measured during the OLTT 1 and 2 hours after administration of the oil bolus). Spearman correlation coefficients are indicated by the size of the dots, p-values are indicated by the color.
Supplemental Material
Download MS Word (571.1 KB)Supplemental Material
Download MS Word (16 KB)Data availability statement
The data that support the findings of this study are available from the corresponding author upon reasonable request. The data of 16S sequencing have been deposited in the French repository at “Recherche.data.gouv.fr” and can be accessible with the following link: https://doi.org/10.57745/MXOF51.