
Figures & data
Figure 1. The anti-rheumatic effect of 630nm LED irradiation on C57BL/6 TNF-Tg mice. (a) Representative images of mice paw on the 20 days after primary LED irradiation. (b) Clinical arthritis score of the mice (Age of 10w after birth). The inflammation levels of mice before PBM were displayed at day 0. * indicates TNF-Tg+LED vs TNF-Tg < 0.05, # indicates TNF-Tg + 2LED vs TNF-Tg (n = 8) <0.05, & indicates TNF-Tg+LED (n = 10) vs TNF-Tg + 2LED (n = 10) <0.05. WT (n = 10); (c) Hind paw thickness changes. (d) RA Score of mice paw on 20th day of LED irradiation. (e) Positive correlations of the RA Score to Paw swelling. Each dot indicates a subject. Solid blue line represents linear regression curve. (f) GSEA plots comparing the four groups. Leading-edge genes from gene sets are shown as black outlined dots. Shaded gray area depicts ART. (g) The proteomic shows the key proteins changes in the TNF-α pathway. P-values by White’s nonparametric t-test, Storey FDR correction.
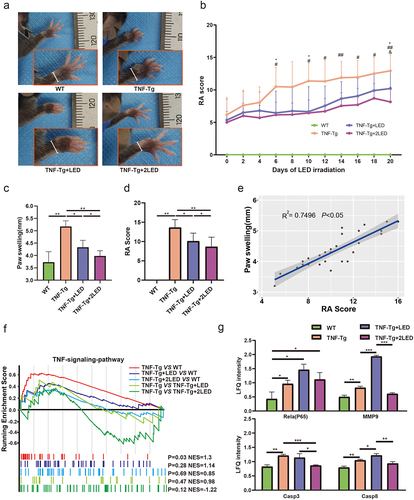
Figure 2. Analysis of the gut microbiota in the colon between four group. (a) Alpha diversity of the gut microbiota between the four groups. (b) Beta diversity of the gut microbiota between the four groups was assessed by principal coordinate analysis using the Bray – Curtis index. (c) The relative abundance of bacteria at the phylum level between the four groups is presented by the colorful columns. (d) The heatmap of relative abundance at phylum level.
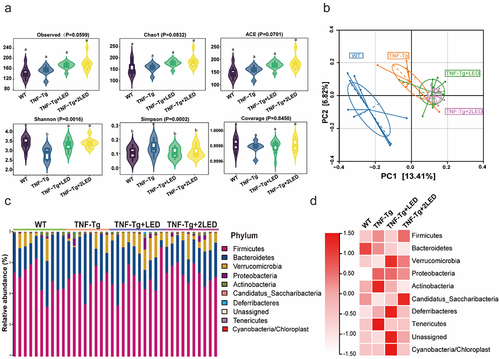
Figure 3. Analysis of the gut bacteria co-occurrence network between the WT group, TNF-Tg group, TNF-Tg+LED group and TNF-Tg+2LED group. (a) Nodes of the network are colored by the degree corresponds to relative abundance of the bacteria. (b) The analysis of four groups co-occurrence network of gut bacteria. (c) The microbial dysbiosis index (MDI) of four groups mice.
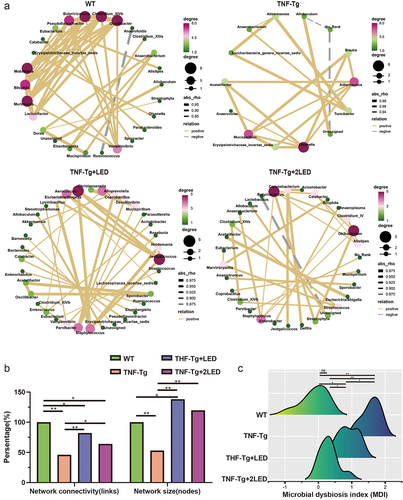
Figure 4. The changes of gut microbial composition at the genus level in WT、TNF-Tg、TNF-Tg+LED and TNF-Tg +2LED group. Chart showing significantly differentially abundant genus (P < 0.01), where genus is grouped and colored by phylum along the y-axis. The x-axis indicates the fold-change in three compared groups as baseline. (b) Boxplots indicating the percentage relative abundance of taxa showing differential abundance among the four groups (P < 0.01). (c) Integrated correlation-based analysis of microbes and RA Score. Pearson’s correlation analysis from the in the three group. (d) The Venn shows the different genus related to LED and RA.
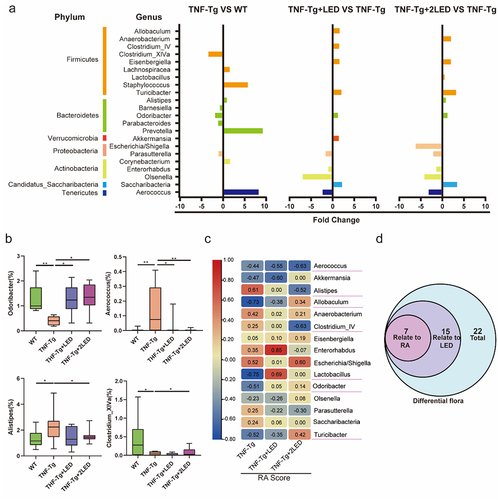
Figure 5. The effect of the gut microbiota modifications on predicted functional metabolic pathways obtained from PICRUSt2 analysis of 16S rRNA sequencing data.
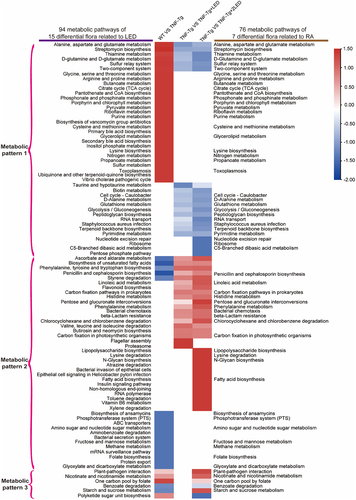
Figure 6. The functional prediction of PICRUSt2 the gut microbiota in mices. (a-b) The Venn shows the numbers of pathways related to LED irradiation and RA process. Each box plot indicates the mean proportion of sequences assigned to pathways in each group. P-values by White’s nonparametric t-test, Storey FDR correction.
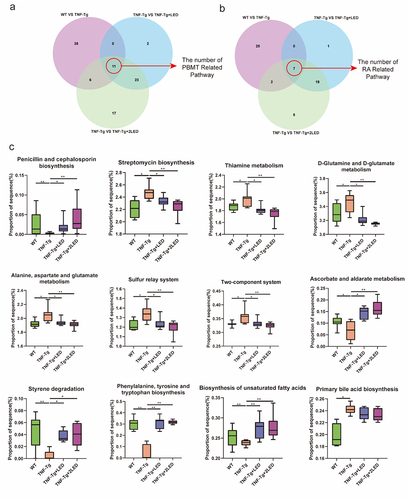
Figure 7. RA related metabolic enzymes, pathways and metabolites of gut microbiota changed in the mice. (a) Each box plot indicates the mean proportion of sequences assigned to the metabolic enzymes in each group-values by White’s nonparametric t-test, Storey FDR correction. (b) Integrated correlation-based analysis of metabolic enzymes in five pathways and RA Score. Pearson’s correlation analysis from the in the three groups. (c) The Sankey diagram shows the correction among the enzyme, pathway, classification and products after the 630 nm LED irradiation.
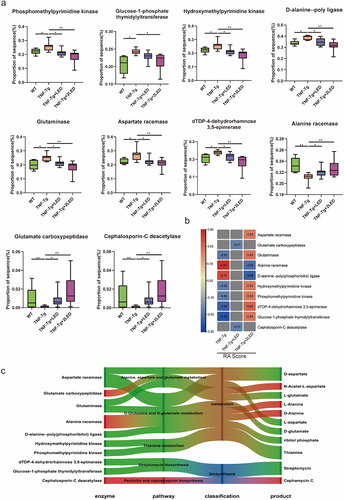
Figure 8. The gut metabolites mediated PBMT effects and its mechanism in the RA process of TNF-Tg mice. (a) The relative expression of IL-1β, IL-6 and IL- 10 after the irradiation of LED or gut metabolites. (b-h) Optimal conformation of molecular docking of alanine (ALA) and N-acetyl-aspartate (NAA) with Caspase3, Caspase8, MMP9 and P65. (i) The proteomic analysis the changes of metabolic enzymes in mice joint synovium. P-values by White’s nonparametric t-test, Storey FDR correction.
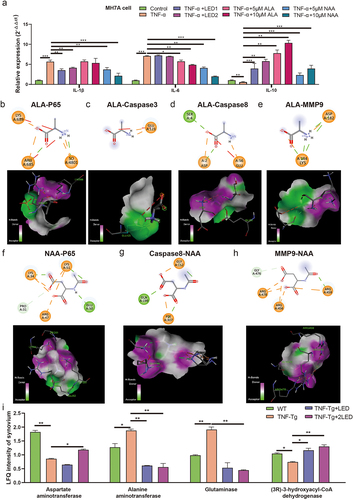
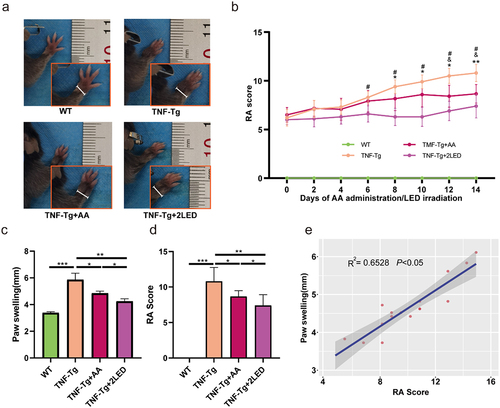
Figure 9. The anti-rheumatic effect of AA (ALA&NAA) administration or LED irradiation on C57BL/6 TNF-Tg mice. (a) Representative images of mice paw on the 14days after primary ALA&NAA administration or LED irradiation. (b) RA Score of the mice on the 14 days after primary ALA&NAA administration or LED irradiation. * indicates TNF-Tg+LED vs TNF-Tg < 0.05, & indicates TNF-Tg+AA vs TNF-Tg (n = 5) <0.05, # indicates TNF-Tg+AA (n = 6) vs TNF-Tg + 2LED (n = 5) <0.05; WT (n = 5. (c) Hind paw thickness changes. (d) RA Score of mice paw on 14th day of LED irradiation. (e) Positive correlations of the RA Score to paw swelling. Each dot indicates a subject. Solid blue line represents linear regression curve.
Supplemental Material
Download Zip (1.1 MB)Data availability statement
All data generated or analyzed during the current study are included in this published article [and supplementary information files] or are available in the NCBI SRA repository, PRJNA1044260.