
Figures & data
Figure 1. Robust decrease in CLDN3 expression characterize IBD patients and mice subjected to colitis.
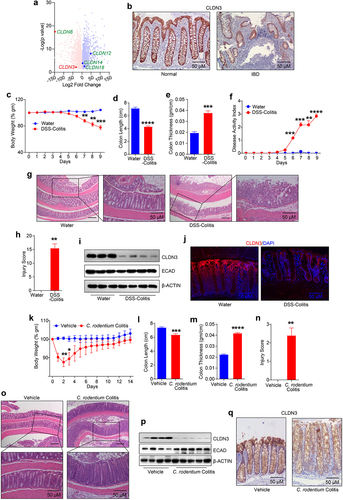
Figure 2. Cldn3KO mice are susceptible to colitis.
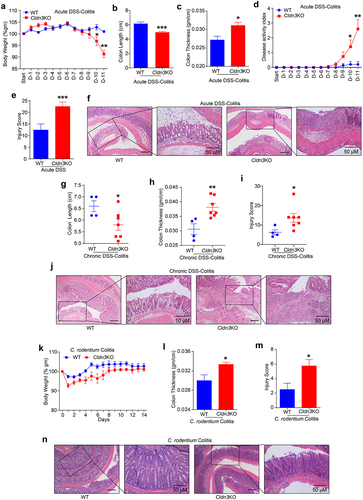
Figure 3. Deletion of Cldn3 expression exhibits deregulated inflammatory signaling.
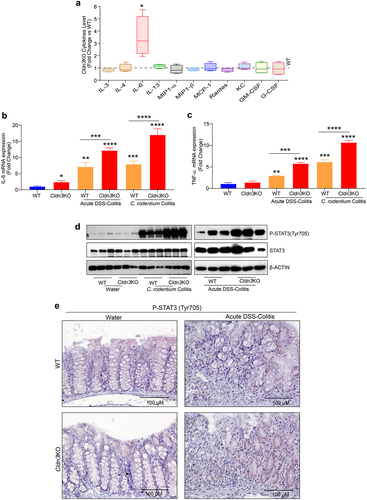
Figure 4. Pseudo-germ-free (microbial depletion) Cldn3KO mice show reduced severity of DSS-colitis.
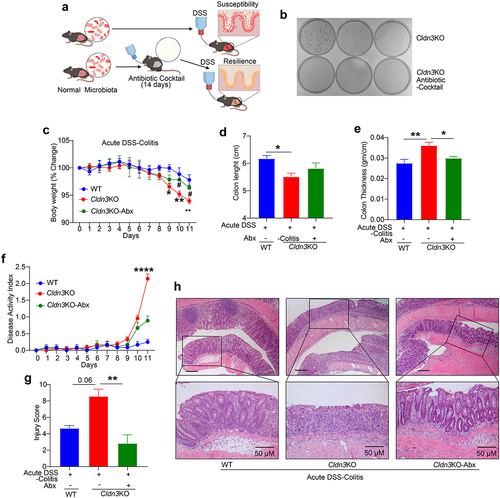
Figure 5. Loss of endogenous Cldn3 expression alters gut microbial composition.
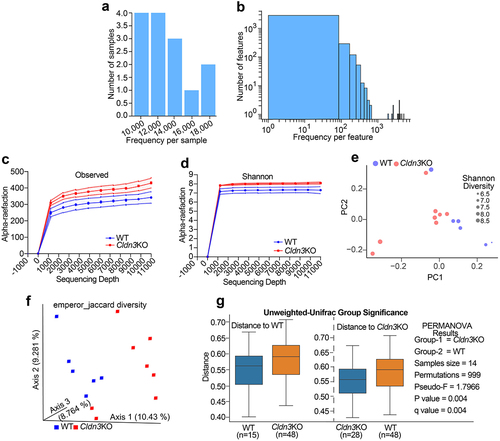
Figure 6. Relative abundance of bacterial communities in Cldn3KO differ from WT.
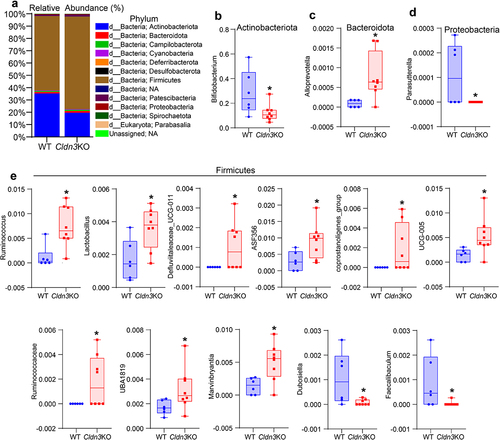
Figure 7. Gut dysbiosis in Cldn3KO mice leads to altered host metabolism.
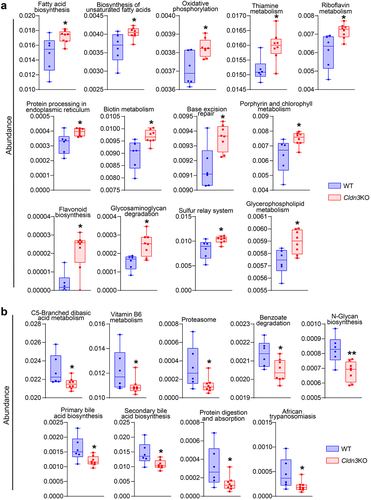
Figure 8. Fecal microbiota transplantation (FMT) from Cldn3KO mice to germ-free C57BL/6 mice induces susceptibility to DSS colitis.
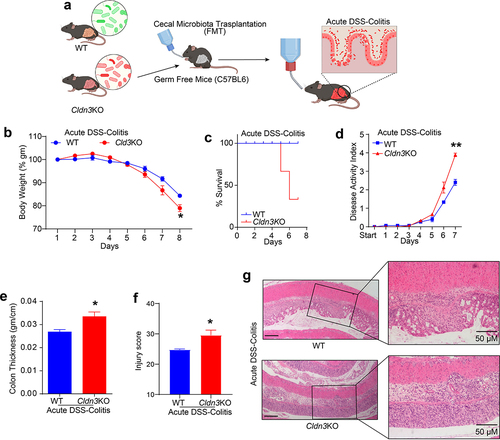
Figure 9. Cldn3KO microbiota potentiates inflammatory signaling in intestinal epithelial cells.
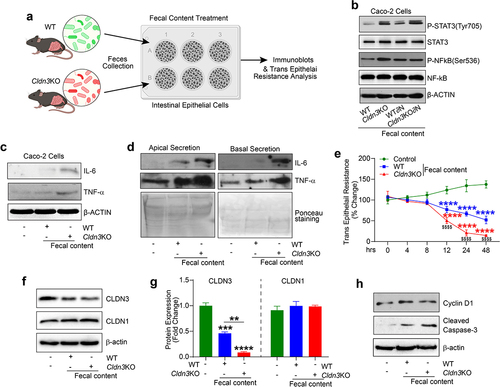
Figure 10. Microbiome associated signaling is altered in IBD and corelates with CLDN3 expression.
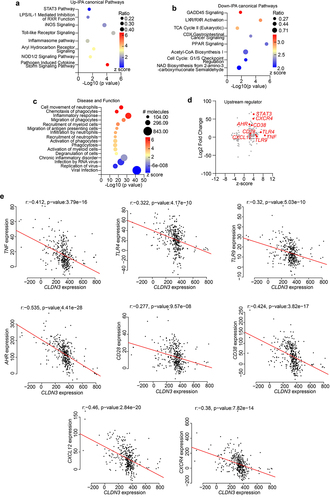
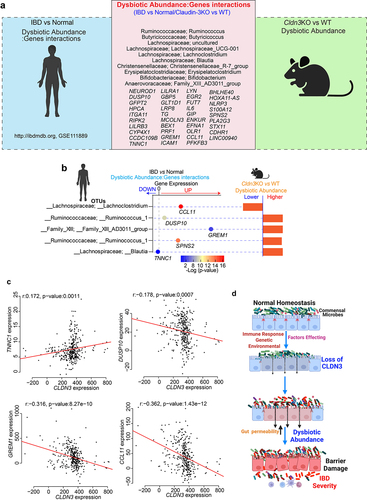
Figure 11. Host-microbiome interactions in IBD patient cohort show overlap with Cldn3KO mice.
Supplementary Table.docx
Download MS Word (13.2 KB)Data availability statement
The data are available upon request. The data supporting the findings of this study are available from the corresponding author upon request.